
Chapter 4 Forecasting Waves for the Normandy Invasion from Surf Forecasting for Invasions During World War II
by John C. Crowell
by John C. Crowell
Professor of Geology Emeritus
University of California,
Santa Barbara
Marty Magic books, Santa Cruz, California
Copyright © John C. Crowell 2010, 2014
All rights reserved.
Printed in the United States of America
Published by
Marty Magic
PO Box 318
Santa Cruz, CA 95061
https://www.martymagic.com/products/surf-forecasting-for-invasions-during-world-war-ii
http://www.martymagic.com/books
Contents
PrefaceChapter 4 Forecasting Waves for the Normandy Invasion II
Autobiographical Sketch Since WWII
Preface
This excerpt is chapter 4 of Surf Forecasting for Invasions During World War II. The other chapters of the book are as follows:
1 Japan Attacks
2 Weather Officer in Training
3 Oceanographic Meteorology at Scripps
4 Forecasting Waves for the Normandy Invasion
5 Forecasting Waves for the Burma Invasion
6 Driving the Ledo-Burma Road
7 Preparing for the Invasion of Japan and the End of World War II
Sixty-six years have passed since the end of World War II in 1945. Beginning about thirty years ago from time to time I began writing up drafts of events and experiences described here. Since I passed the age of 92 about two years ago I have turned to finishing the project.
John C. Crowell 2010
Chapter 4 Forecasting Waves for the Normandy Invasion
After completing the course at Scripps and a few days leave to my home in Claremont, my army orders designated that I was to return to Memphis. After a month, however, orders came through sending me to England by air. First, however, I had a delightful week in New York City before a seat was available for me on a cross-Atlantic flight. Twice each day I telephoned to learn whether I was flying out in a few hours or at some time later. I became a tourist and visited museums, city sights, and especially enjoyed Broadway shows, including Tobacco Road. Soldiers in uniform on official leave could always get a seat on short notice. Finally I flew out of La Guardia Airport in a crowded C-54 transport plane first to Presque Isle, Maine, then Stephenville, Newfoundland, and finally on to Prestwick, Scotland.
As we flew over the North Atlantic in the middle of the night, the copilot came back to the passenger cabin to mention a small difficulty to passengers near the front where I could hear. He was nervous as he explained that they had failed to raise Keflavik, Iceland, on the radio, an alternate airfield in case we ran into trouble. We were now beyond Iceland over the Norwegian Sea, but expected to tune in on Prestwick soon. Those of us who heard him, scrunched down into our seats and brooded over the likelihood of ditching in the rough and choppy October ocean. Such a landing would certainly be the end of us. The copilot returned to the cockpit and we heard nothing more but finally landed safely in Scotland with no further anxieties. Although we were cold during the long night and bouncy flight, all went well after all.
Upon arriving in London by train on October 11, 1943, I reported to Colonel T. S. Moorman, Jr., Control Officer of the 21st Weather Region, U.S. Army Eighth Air Force (late in the war he was the commanding general of the U.S. 15th Air Force in the Philippine Islands and later as a Lieutenant General served as superintendent of the Air Force Academy near Colorado Springs). I was ordered to Woolacombe, the site of the U.S. Army Assault Training Center on the coast of north Devon facing westward into the Bristol Channel and the open Atlantic Ocean beyond. Upon arriving at Woolacombe, protocol required that I report to the commanding officer. A Victorian resort hotel was now the headquarters of the center, so I marched up to the second floor and along a dim hall to a private soldier serving as the commanding officer’s clerk, sitting at a tiny table outside of a double door with etched designs on the glass. I explained the purpose of my visit and stood about for several minutes. The clerk then led me through the elegant doors into a huge room, probably the hotel ballroom, with bay windows facing out to the sea beyond. There was no furniture in the large room except for one desk with one chair behind it: the colonel’s chair.
The colonel stood up as I came in. I popped to and saluted, a salute that he returned very properly.
“Second Lieutenant Crowell reporting for duty as ordered, sir.”
“What outfit do you belong to?”
“The 21st Weather Squadron, sir—I am ordered to join the C. O. of your local weather station, sir.”
All during this conversation I stood at attention, although the colonel had sat down in his chair after my initial introduction. He caught me a bit off base with:
“What good do you think you will do the war effort?”
“Hmmm, ahh,—we will make weather forecasts, especially forecasts of surf heights for the invasion,— before and after, sir,—Here at Woolacombe we want to learn how different landing craft behave in surf of different roughness, sir,—and practice forecasting,sir.”
“Dismissed.”
As I saluted and spun about and moved toward the door, he muttered, largely to himself. “You’d probably be a lot more useful behind a rifle shooting Germans.” After the invasion I learned that the colonel had been killed during the assault. No doubt he was a tough and able field commander.
For about a month I worked with the staff of the weather station on the beach at Woolacombe where they made weather observations and forecasts for the benefit of operations. Here troops practiced landings from different types of landing craft under different surf conditions. At Woolacombe, Technical Sergeant Ernest A. Lochner, one of the weather radio operators, worked with me as we undertook wave research, and later was a mainstay of our wave forecasting groups in London, Ceylon, and Manila.
Several questions emerged at Woolacombe. How should surf observations be made accurately and efficiently? Could they be improved? Methods were needed to make these observations from shore, and from a standardized place that could be occupied regularly. Observations on breaker height and period from distant storms were needed as well as on locally generated wind waves. How did different types of landing craft behave under specific surf conditions? For example, if wave heights were forecast as between 4 and 5 feet, what would this mean to captains of the different types of landing craft? Was the wave period (the time between significant breakers) of concern to him? Should our wave forecasts distinguish between long-period swell coming in from distant storms in the Atlantic, or should they dwell only on the character of the breakers and surf at the landing zone itself?
It is difficult to observe and measure wave heights from the beach and especially where the sea floor slopes gently seaward and the distance to the breaking zone is relatively far away. There is no easy way to determine the distance from the strand line to the breakers accurately without some kind of marker such as a fixed buoy, pier, or isolated rock. One of our officers had worked out a method using artillery binoculars with an internal graticuled scale: if the binoculars were held at a level and calibrated for distance the scheme allowed an approximation of the distance to the breakers along with an estimate of their height. Wave observations were collected from October 1943 until May 1944 by the weather personnel at Woolacombe and carefully analyzed by Lochner. We used his analysis to judge the accuracy of forecasts made by different forecasting methods. Lochner was a very able scientist and more competent in statistical analysis than any of us, but was denied training to become an officer because his father was from Germany and several close relatives were still there, so his security status was in question. Security officers were concerned that an American with high clearance would be “blackmailed” by the Germans unless secrets were revealed. The Germans would threaten to imprison or harm the relatives unless secret tales were told. After transfer to London and the preparation for the Normandy invasion was underway, however, he was granted top-secret clearance. After the war and completing his doctorate in ichthyology at Cornell University, he had a fine career as curator of fishes for 34 years at the Smithsonian Institution in Washington. He retired in 1983 and died at 80 in 1986.
As the invasion date approached and we were working hard on developing wave-forecasting techniques, we attempted to enlist the help of H. U. Sverdrup and J. Bjerknes, our professors at Scripps and UCLA. We could have profited from their expertise and experience. We were denied our request, however, on the same security grounds. They both had relatives in their homeland in Norway at that time under German occupation.
At Woolacombe to gather good information on wave heights and periods within the breaker zone we took trips in ungainly DUKWs, amphibious truck-like craft. Hulls are assembled around a 1 1/2 ton army truck chassis so that on land they have six-wheel drive and a maximum land speed of about 55 miles per hour. In the water a propeller is engaged and they can attain a maximum speed of about five miles per hour. Our driver and two of us drove into the water from a sheltered cove near Woolacombe and worried and wobbled and rocked our way to a point opposite the weather station and just seaward of the breakers, and located ourselves by taking bearings on conspicuous buildings on shore. Here we bobbed up and down and rolled from side to side with one observer making measurements of the water depth and wave height. The other observer huddled in the bottom of the DUKW to take notes and to time the interval between major crests with a stopwatch as his buddy called out measurements and times of crestings or troughings. We used a long pole, much like a crude fishing pole, with a line attached and an iron weight at the bottom. At foot intervals on the “fishing line” we tied colored ribbons at one-foot intervals so we could call out the water depth when each significant crest and trough passed. With the weight on the bottom it was relatively easy to hold the pole so that the line was taut and vertical and use the markers to call out the wave heights. The offshore slope of the bottom was exceptionally gradual at Woolacombe so we were also gathering data on the effect of shoaling on waves as they came into shore.
This simple scheme worked reasonably well except for severe shortcomings: all three of us (driver and two observers) would get seasick and at times viciously, so it was difficult to carry on. We were never able to decide whether it was better to go to sea before breakfast on an empty stomach, afterwards with a full stomach, or just when. Another shortcoming was that the scheme worked only when the waves were moderate and not during storms or times of really significant waves. After all of our wretched retchings we got some useful data, however, but most of all a first-hand appreciation of what soldiers would face in a landing craft as they stormed a beach!
At Woolacombe I was first billeted in a pyramidal tent near the weather station, with mud all about during frequent rains and blowing sand when the weather was dry. Later I was transferred to a small and comfortable room in a home on the steep hillside back of the beach. Here several of us shared an inside bathroom, a luxury in comparison to the tents and outdoor water taps where we could fill our helmets, serving as wash basins. I took my meals in the cavernous basement of the headquarters building at the Junior Officers Mess.
One day several of us drove in a jeep southward along the coast to Bideford Bay. We wanted to observe how waves came into the coast as they approached headlands or beaches. We drove out upon the sandy floor of the estuary when it was low tide, but we were unfamiliar with how quickly a tidal bore would come up Bristol Channel. Suddenly a bore came racing along and water swirled around the wheels of the jeep. As our driver turned about quickly the sand beneath us softened, and we were stuck. In a panic, he rocked the jeep back and forth in four-wheel drive but we only dug in deeper and deeper. We decided to run for it on foot so we splashed ashore leaving the jeep behind as the tide came in faster and faster. I never learned the true sequel: Did the jeep survive the night? Was it rescued by motor pool people during the next low tide? Or is there a buried and rusty jeep below the sand that might be discovered even today by using a magnetometer?
On one of my trips in London, during a very foggy and rainy spell in November or early December, I was asked to join a reconnaissance flight from an airbase north of London. The plane, a B-17 Flying Fortress fitted with large fuel tanks within its bomb bay, was scheduled to make a long triangular flight over the North Atlantic Ocean to observe the weather. I was to make wave observations when I could see the sea surface, and estimate the roughness, direction of wave travel, and, if possible, the wave length and height. The flight was scheduled to take off at 2 a.m. so I set off in a jeep with a motor pool driver in the early evening for the estimated two-hour drive. The fog came down as we pulled out of the northern suburbs of London, however, and we could not find our way. Road signs had been removed early in the war so that any enemy parachutists dropped into the region would also get lost. From time to time on our trip we stopped and I got out and studied the pattern of road intersections using a poor road map as a guide. My driver had made the trip before and felt that he knew the way but he was also baffled. We drove through many completely blacked-out villages and hamlets. In the darkness of night, no pedestrians were about and no pubs or hotels were open or visible. We could not even find a local constable or police station. Finally at about 2 a.m., and very late, we arrived at last at the airbase. Our flight had left only a few minutes before, without its wave observer. I learned later that it had never come back and had gone down somewhere over the North Atlantic and all persons on board were lost. Such is the luck of war.
In November 1943, I was billeted at different places when I traveled to London from Woolacombe. Several of these billets were on or near famous London streets, such as Baker, Wimpole, and Half Moon. During one of these visits, sirens screeched loudly during what was called the ‘Little Blitz.’ Building occupants were expected to gather in nearby bomb shelters, usually along platforms or passageways of the Underground. During one night, bombs severely damaged a building near my billet and in the morning the street was blocked by fallen debris. Several people had been killed or badly wounded. By this time in the war the British had stoically grown accustomed, more or less, to these incidents.
In preparation for the invasion of Europe, the Allied High Command had delegated military matters pertaining to the sea to the British Royal Navy. Colonel Moorman therefore offered the services of his oceanographic meteorologists to Captain L. G. Garbett, CBE, RN, Director of the Royal Navy Meteorological Service, with the approval of Commander Richard C. Steere, USN, the senior U.S. naval meteorologist in London. (Captain Garbett, by the way, was the brother of the Archbishop of York, the second highest prelate in the Church of England after the Archbishop of Canterbury.) In November and December I therefore made several trips to London for discussions with senior officers, both American and British. In particular I had technical discussions with Instructor Commander C. T. Suthons, RN, who had studied waves and prepared a memo on wave forecasting (Suthons, 1942). His method was based largely upon observations and was more empirical than the Sverdrup-Munk method, a method largely based on physical principles (Sverdrup and Munk, 1943, 1944). How could we find out if forecasts using the two methods were similar or different? Should the wave forecasters for the invasion use one of them or both? Was there a way to test the two methods and calibrate them? We all recognized that the issue was important, so Captain Garbett and Colonel Moorman decided to send Commander C. R. “Dick” Burgess, RN, and me on a trip to Northern Africa.
North Africa and Azores
The purposes of our trip to the Mediterranean region and the Moroccan shores facing the Atlantic Ocean were threefold:
1) To learn what we could concerning wave conditions and wave forecasts made during landings on Morocco in November 1942, under “Operation Torch.”
2) Was there useful information on wave forecasting techniques used during the landings on Sicily, beginning on July 10, 1943 and at Salerno, Italy, beginning on September 9, 1943? Could these experiences help in our task of forecasting for the forthcoming invasion along the coast of continental Europe? and
3) Could we arrange for swell observations in North Africa and perhaps the Azores in order to compare and test the Suthons and Sverdrup-Munk methods? The northwestern “hump” of Africa faced swell coming from North Atlantic winter storms and so we might obtain useful data on swell from distant wave generation areas.
Munk, in the summer and fall of 1942 had worked for the U.S. Army Air Corps Weather Directorate on surf forecasts for the then-forthcoming Operation Torch (Munk and Day, 2002). Sverdrup joined him in the Pentagon and they both worked together for most of October. The pair prepared predictions for the successful landings on Moroccan beaches but I do not know what role the forecasts played in timing the invasion. Beyond doubt, however, the experience added to their knowledge of wave behavior and contributed significantly to their 1943 and 1944 reports upon which we leaned heavily, and issued by the Hydrographic Office.
Burgess and I took off from an airbase near Penzance, Cornwall, (on the road to St. Ives) in the middle of the night of 27 December 1943, crowded into a Royal Air Force bomber refitted for shuttling passengers and mail between England and Gibraltar. Fellow passengers were largely British with only a few Americans. We scrunched into canvas seats with our knees touching the back of the seat in front of us. Rather fortunately I was assigned a seat at the back of the plane so that, when we were well underway, I lay down in the aisle upon sheets of newspaper and got some sleep during the long flight. The cabin was completely dark. During the night a couple of fellow officers stumbled over me as they went to the restroom at the rear of the plane. Our route was due west far out into the Atlantic to be well clear of France where German aircraft might fly up and shoot us down. Before turning southward, we also had to clear Spain and Portugal, and then flew eastward to Gibraltar.
At Gibraltar, Burgess took a flight to Casablanca and I to Algiers, arriving in time for a late lunch. I made appointments by phone with officers at the Algiers airbase weather station and at the Headquarters of U.S. Mediterranean operations. The conclusion from discussions in Algiers was that forecasts of local winds were of paramount importance, and these needed to be as accurate as possible, and made at least two days before any landings. No one seemed concerned about waves generated in storms over mid-Mediterranean fetches at distance from the landing beaches. Problems at Salerno were hampered when waves were higher than 3 to 4 feet when some landing craft broached. These comments were entirely anecdotal and tended to confirm our observations of landing craft behavior at Woolacombe. No one I talked to knew of any written reports describing surf conditions during either the Sicily or Salerno landings.
For the few nights I was in Algiers I was assigned to a room on the top floor of a decrepit hotel in a hilly part of the city. It remains in my memory because the hotel was about six stories high and the rear dropped off vertically into a deep ravine. On each floor there was a toilet in a small closet or outhouse hanging out over the ravine. These were staggered floor by floor so that toilet contributions had a clear fall into the ravine, and not onto a toilet hutch directly below! Slimy showers and flush toilets were located on every other floor within the building but most visitors during the night used the suspended-hutch outhouses.
On the last day of the year 1943 I flew in a DC-3 Dakota from the Maison Blanche airport in Algiers to Casablanca (from one “white house” to another!). The flight path was along the trend of mountain ranges with the high Atlas on our left, rugged and snow-capped, so I had grand views of the geology beneath us and wished that I were on the ground walking about as a field geologist mapping strata and faults and folds.
I arrived in Casablanca in time to meet Burgess and join a New Year’s Eve party to which he had been invited. It was in a private home with the crowd of guests oozing out of the living room onto an open patio. French was the dominant language, and only a few guests were chatting in English. Strong Moroccan and Algerian wine flowed freely.
During the next 12 days Burgess and I set up a wave observation scheme so that we could get heights and periods of swell coming to the Moroccan coast from storms far away in the North Atlantic. We needed a place where shore observers could clearly see the swell as it came ashore and measure wave heights and the timing between arrivals of major crests. Fortunately the scuttled and grounded battleship Jean Bart was at hand. During Operation Torch, on November 8, 1942, the Vichy French Battleship had been heavily damaged by shells and dive-bombers from the USS Massachusetts, USS Augusta, and other war ships so the out-of-action Jean Bart was tied to the dock and was now resting on the harbor bottom. Burgess obtained permission to paint stripes on the hull facing swell from the open ocean, showing heights from the harbor bottom, and visible from a suitable observation post at the end of a pier onshore. We therefore took a workboat to the scuttled battleship, dropped a boson’s chair over its side, measured the water depth next to the partly sunken ship, and painted our stripes and labeled them. We undertook this work at low tide when the waves were minimal. Our hope was to “catch” an episode when high surf came crashing into Morocco, and relate its waves to particular storms in the North Atlantic. Arrangements were also made for two groups of observers to measure waves, looking at the end of a long breakwater and also at a buoy in deeper water farther out to sea. A bomber was scheduled to take vertical photos of the surf and waves from the air. While we were in Casablanca, however, no strong surf came crashing ashore, so we were disappointed. When we returned to London, any data acquired were analyzed by Commander Suthons but we were then only slightly concerned because by that time we knew that the invasion would take place within the Bay of the Seine, pretty well protected from swell generated by north Atlantic storms.
In order to add wave observations of swell from the northern open North Atlantic, I flew to the Azores from Rabat, Morocco, on 12 January but arrived on the 14th! Our U.S. Navy cargo plane had only a few seats for passengers and was used mainly for carrying mail between Africa and the U.S. One of our passengers was an important diplomat who was being flown back to the U.S. for conferences. He slept on a cot near the rest of us passengers, who slouched in canvas seats just forward of a huge pile of tied-down mailbags and assorted boxes. Upon our arrival over the Azores, however, about 40 per cent of the way across the Atlantic, the airport was fogged in. So we circled about for a few minutes and then flew on to Stephenville, Newfoundland. Our diplomat was transferred to another plane for his flight to Washington, and after two nights at Stephenville, my plane retraced its course to the Azores and landed at the Lagens Airbase on Terceira.
The local RAF weather officer at our Azores Island and I drove out to a Portuguese oceanographic station on the north coast of the island. Here I discussed our hopes with the assistant director, who spoke Portuguese primarily and understood very little English, and neither the RAF officer nor I could converse in Portuguese. From a window looking out upon rocks there was a full view of breaking waves. He agreed to send reports of wave observations to the Lagens weather station by telephone when there were times of significant waves. At the weather station the data would be encoded along with weather transmissions and sent by secure radio to London.
The weather pattern for a typical storm firing waves to the North African coast is illustrated in Figure 4.1. With high pressure on the south and low on the north, winds on the gradient between them blow toward the ESE. The strength of the wind is shown by the crowding of isobars. In the generation area (F in Figure 4.1) the winds and the resulting waves are aimed directly toward Morocco. As these waves travel out of the generation area toward the ESE they travel across the decay area (D in Figure 4.1). In the decay area they travel as swell where wave lengths (distances between wave crests) and periods (timing between passage of wave crests) increase. When this train of swell reaches shallow water near the coast, the swell begin to “feel the bottom.” That is, the vertical orbits of water particles as the waves move by are inhibited so that wave-lengths decrease and wave-heights increase until breakers form. The local weather at the coast may be clear so that booming large waves may crash into the shore with long intervals between breakers, or, if there are local wind waves, these will be superimposed upon swell arriving from distant generating areas. We hoped to compare the arrival time of waves and their periods and heights at Terceira with those from the same storm at Casablanca as a test of our forecasting methods. The characteristics of the storm would come from weather maps over the North Atlantic. So far as I know, if such a study of wave measurements was ever made, the data were sent to Commander Suthons in London but I have never seen a report describing them. Our quick and uncertain comparisons of swell heights and periods were similar using either the Suthons or Sverdrup-Munk methods. The Sverdrup-Munk nomograms were a bit easier to use rapidly, however, so in forecasting swell entering the western approaches to the English Channel during the invasion, we usually reached for them.
The plates in the Sverdrup-Munk volume consist mainly of nomograms showing:
1) The time in hours needed by a wind of given velocity to raise the highest possible waves at the end of a given fetch,
2) Wave height and wave period as functions of wind velocity with both short and long fetches,
3) Wave height and period as functions of wind velocity with both short and long durations,
4) Decay diagrams showing the ratio between wave height at end of decay distance as functions of wave period at end of generating fetch and decay distance, and
5) Several others.
We continued to forecast swell entering the western approaches to the English Channel throughout the existence of the Swell Forecast Section both before and after the invasion for the use of captains of ships at sea.
We adapted several of these nomograms to our specific needs in forecasting waves for the Normandy beaches within the Bay of the Seine. Particularly useful were surf forecasting diagrams that we designed as described below. The sheltering of Normandy beaches by the Cherbourg (Cotentin) Peninsula from direct swell coming in from the North Atlantic, however, placed our concerns at relative ease. Thankfully the surf at the proposed landing sites would be the result of winds largely within the English Channel itself, so we concentrated on learning all we could about how to forecast them.
Terceira is a volcano so the geologist in me enjoyed the drive along its northern flank. The terrain is rugged and stony, so farmers had gathered loose boulders and built thick walls around their small fields in order to get rid of the annoying boulders and expose fertile soil. In fact, the size of the fields revealed the stoniness of the ground. Where the terrain is especially bouldery the fields are small as along slopes near the volcano. The more distant alluvial planes near the shoreline have larger fields with thinner walls. In looking down on the changing patterns of the walled fields from the air in flying in and out of Lagens this relationship is quite noticeable.
On our trip back to London, Burgess and I spent five relaxing days in Gibraltar waiting for seats on a night plane to England so we strolled about the ancient city and harbor as typical tourists. Burgess had several friends in the critical naval base and one of these, Captain C. H. Lush, RN, invited us for an evening sherry party at his flat. His hobby was collecting and studying recipes for different types of cheeses. He opened a chest and showed us several tins of cheeses all nicely labeled with their provenance. An odor of cheesy mustiness rose as he lifted the lid of the chest and a real stink came out of one of the tins when he lovingly unscrewed the lid and sniffed it. He especially gloated over his goat and mare cheeses from the Middle East. He had no refrigeration and I never learned whether he actually ate some of his cheeses when they were on the verge of rotting.
As a junior transient officer I was billeted during my sojourn in Gibraltar in an ancient barracks overlooking a parade ground. My sleep was shattered each morning at 6 o’clock when a contingent of Scottish soldiers gathered directly below my bedroom window. For a half-hour they paraded back and forth to the raucous squeal of bagpipes. Sleep was impossible during the racket. Only much later, in 1960 on a sabbatical leave to Scotland, did I begin to appreciate bagpipe “music.”
We arrived back in London on January 30, 1944, after our long nighttime flight and a train trip from Penzance. I had brought some fruit from Morocco with me and recall the thankfulness of a mother and her two small children riding with me when I gave each child an orange and a banana. One of the children was so small that he had never seen a banana and the other could barely recall oranges and bananas. Their mother immediately peeled them and the children ate them because both fruit were a bit beyond being thoroughly ripe.
London again
The Swell Forecast Section was organized formally in February 1944 as part of the Royal Naval Meteorological Centre located between the Admiralty Arch and St. James’s Park in central London. The name “swell” was attached, not as a description of the quality of our forecasts, but for security reasons to suggest that we were concerned with deepwater waves, presumably coming to any potential landing area around the coast of Europe from storms far away. Perhaps any German intelligence officer would think that the landings were planned for some beach in the Bay of Biscay or as far northeast as the shores of the North Sea.
We were assigned a small room down the hall from the main “met” center where weather maps were continually being plotted and revised, and weather forecasts prepared. In our small sub-basement room we had four desks arranged in a tight block so we faced each other and it was far too easy to chat than to work hard. It would have been most useful to have placed a large-scale map of the English Channel area including the Normandy beaches on our wall so we could gaze at it and muse over our responsibilities. This we could not do for security reasons inasmuch as some charwoman or person not carrying a high security clearance might wander by and learn at a glance too much concerning secret plans. The center was within the lower basement of the old Admiralty building adjoining a tan concrete building referred to as “The Citadel,” a building that rises a few stories above street level next to the Horse Guards Parade but has many of its facilities well below street level. It was the main communications center for the Royal Navy with sectors separated by strong steel doors, some of which were gas proof. When I last visited London a few years ago, the building was still there but overgrown with ivy. The Officer-in-Charge of the Met Centre when we first established the Swell Forecast Section was Instructor Commander J. Fleming, RN, DSC, but in May 1943 he was transferred to serve as Staff Meteorological Officer to Admiral Sir Bertram Ramsay, RN, KCB, KBE, MVO, the Allied Naval Commander in Chief of the Expeditionary Forces (ANCXF). When Commander Fleming set up his weather office at Southwick House at the headquarters of General Eisenhower near Portsmouth, Instructor Commander C. Young, RN, took over the supervision of the Met Centre at the Admiralty. Fleming was a serious officer with military demeanor, and I remember well his occasional visits to our office when he would rap vigorously on our door with his formal walking staff. With this warning we could all jump to attention as he strided in. At the end of his career he had become a Vice Admiral.
Our Swell Section as finally organized and operating was staffed by Instructor Lieutenant Harold W. Cauthery, R.N., Lieutenant Charles C. Bates, USAAF, and me (Fig. 4.2). Cauthery had obtained honors degrees in both mathematics and history from Cambridge University followed by several years on British warships. He became a fast personal friend and I visited him and his wife several times after the war at his home at Haslemere south of London. He completed his career as Permanent Secretary in the British Civil Service and served for a long time as the Personal Assistant to the Minister of Housing and ended as Chief of Administration, Royal Air Force. Bates, who had been serving as a weather forecaster in Stephenville, Newfoundland, was one of my oceanographic classmates at Scripps, so it was great to have him with us. He had also been a geologist as well as a geophysicist before the war with experience in the petroleum industry, so we had much in common. We were ably assisted in the Swell Forecast Section by Sergeants E. A. Lochner and E. L. Hynes, USAAF. Two WRNS (Women’s Royal Naval Service, but always called “Wrens”) were added to the Met Centre to help in plotting maps.
Our studies of waves breaking upon the shores of continental Europe separate into:
1) Those studies before we knew the proposed sites and timing of the Normandy invasion, codenamed Operation Overlord, and
2) Those afterwards when we were “bigoted,” and given this “top-secret” classification applied to persons who required this information.
After we were bigoted we concentrated on sharpening our forecasting techniques for the landing beaches in the Bay of the Seine. Before bigoting we had assumed that the landings would occur at any suitable beach or beaches along the European continental coast from the shores of the Bay of Biscay to the Netherlands even though we surmised that the French coast of the English Channel was most likely for any major military thrust. We should be prepared to make forecasts for commando strikes at any place along the European coast. If additional landings were needed in support of the Bay of the Seine beachheads, we understood that there were contingency plans. These supplemental landings might then be launched south of the Brittany (Brest) Peninsula along the northern coast of the Bay of Biscay between the French ports of Lorient and St. Nazaire. The northeastern side of Belle Isle and beaches protected from waves by the Quiberon Peninsula seemed to us as especially attractive.
If the invasion of Western Europe had failed completely, and Rommel had succeeded in repelling the Allies, we learned unofficially that planners thought that it would take at least a year to build up another invasion armada. If this had unfolded, the Allies would probably have given up and lost the war.
Wave observation stations in Britain
We organized a network of wave observation stations along the coast of England from North Devon, around Land’s End, eastward along the English Channel, and around to East Anglia facing the North Sea (Fig. 4.3). Many of these observation points had been manned since the beginning of the war as lookouts for possible German invaders or marauders. Most stations were manned by retired Coast Guard men familiar with observing sea conditions. The station network, aided by two Wrens, was under the supervision of Lt. (Sp.) J. H. C. Fulford, RNVR (Royal Navy Volunteer Reserve). Most of the lookouts used rocks or piers or buoys to determine the distance and wave heights and only a few instruments to make the observations more accurate were available. The two Wrens were able to supplement what they saw with their eyes by a few pressure-gauge instruments laid upon the sea floor. In fact, after we had completed our assignment for the Normandy invasion and were transferred to the Bay of Bengal in the Indian Ocean, and then to the western Pacific, we had high hopes of getting many more of these gauges but we never got enough. Observations at the English stations were encoded at the end of weather transmissions relayed by telephone and teletype to the Met Centre three times a day from a nearby weather station. We prepared recommendations for what was needed in these codes, and how the observations should be made. The codes consisted of a string of numbers giving the wave height and period that could be encrypted as the message was dispatched by radio and then decrypted in London.
We also made arrangements for pilots in pursuit planes to take a look at surf zones as they zoomed over coastlines, but their planes went so fast, and usually at such high altitudes, that that the few observations sent back to us were of little use. A few days before the planned invasion we learned that photographs of critical assault areas from speedy Mosquitos (twin-engined planes) had been requested by beach engineers. The engineers, responsible for removing beach obstacles at the beginning of the assault, wanted recent photos to pinpoint critical obstacles, and to evaluate the hazard of sites. We would profit as well by additional knowledge of the effect on waves of bars and runnels. Security required, however, photos of most of the coast from Brest to Holland so as not to reveal to the Germans any details of places the Allies were particularly interested in. As a result when I drove out to a warehouse on the edge of London, I found a huge stack of photos and spent much time using index sheets in finding those photos I wanted to look at. I could not take them back to our Admiralty office and was allowed only to take a few notes. The photos I examined briefly only pointed out the difficulties that bars and runnels might cause invading troops. Our wave forecasts were only in general terms, however, as are any weather forecasts. Our methods did not allow forecasts for small and limited specific beach localities so we did not ask to examine any additional photos from future photographic flights.
Bates and I visited many of the English coastal stations in early 1944 so that we could determine the exposure of the beach or point of land where wave observations were actually made. Some stations, however, did not afford clear views of the surf or breaking waves so we concentrated on those where observations would be reasonably accurate and helpful. At these localities we took notes and left instructions to observers on what we needed in London. Bates visited the eastern stations and I the western. In a simplistic way we were assuming that a steady wind from the south across the English Channel would raise waves on the English coast quite like those arriving on the Normandy beaches with a north wind.
At first we were concerned that swell coming up the English Channel from the open Atlantic might refract or bend around the tip of the Cherbourg (Cotentin) Peninsula and arrive at the Normandy beaches but later decided that refraction of such swell posed only a minor risk. We also attempted to evaluate the effect of longshore currents, or those currents near the shore that might sweep a landing craft sideways along the beach. We early decided that bars and runnels and local orientation of the shoreline so influenced the strength and direction of longshore currents, that we could not forecast such local details. The captains of landing craft themselves would have to be on the lookout for them.
When the Swell Forecast Section became fully operational we prepared at least two forecasts each day when usually two of us would join the secure (scrambled) telephone conference between three weather centers and three staff weather officers; six phone lines all hooked together. The weather centers were:
1) U.S. Strategic Army Air Forces (code named ‘Widewing’) at Teddington where the principal weather forecasters were Lieutenant Colonels B. G. Holzman, and I. P. Krick, USAAF,
2) British Air Ministry and Royal Air Force at Dunstable with Mr. C. K. M. Douglas and Dr. Sverre Petterssen, both experienced civilian forecasters, and
3) Admiralty, where we were located. Here the principal weather forecasters were Instructor Lieutenants Geofrey Wolfe, RN, and Lawrence Hogben, RNZN (Royal New Zealand Navy) with occasional participation of Instructor Lieutenant Commander John R. Thorpe, RN. Hogben was the first New Zealand Rhodes Scholar to get a PhD in mathematics from Oxford University and held the Distinguished Service Cross for being the navigator of the ship that shadowed the German battleship Bismarck to its demise after sinking the British battleship Hood.
Fifty years later, in 1994, I gave a lecture on tectonics before a group of geologists in New Zealand (Lower Hutt), and introduced my talk by mentioning that the anniversary of D-Day followed in a couple of days. I stressed the most significant role that their countryman Hogben had played in making weather forecasts. Most of my audience had not heard of Hogben and had pretty much forgotten the significance of the date in world affairs although it was marked on the New Zealand calendar as associated with the official Queen’s Birthday.
The three staff meteorologists were located at:
1) General Eisenhower’s headquarters at SHAEF (Supreme Headquarters Allied Expeditionary Forces),
2) Allied Air Headquarters, and
3) Allied Naval Commander, Expeditionary Forces.
At the time of the critical weather decisions in early June, Eisenhower’s staff weather officer was Group Captain J. M. Stagg, RAF, replaced from time to time by his deputy, Colonel D. N. Yates, USAAF. After the Allies obtained a ‘toehold’ on France, Squadron Leader G. D. Robinson, RAF, now and then replaced Stagg. Yates took over as Eisenhower’s staff weather officer for Operation Overlord as the successful assault became secure and the invasion of the continent gained momentum.
As the weather forecast was prepared for the initial assault, one or two of us wave forecasters would stand behind the seated duty meteorologists and listen carefully to discussions on the scrambled phone. The active weather map was in front of us. First, agreement among the three met centers concerning the present weather map was required, and this often involved lengthy discussion. For example, just where was the actively moving weather front at the present time? This was followed by discussion of forecasts 12 hours ahead (later 6 hours ahead at the time of the assault), and up to five days ahead. We actually had little confidence in 3-, 4-, or 5-day forecasts so the language for them was hedged. Most of these scrambled-phone discussions were difficult and at times lengthy.
The Widewing meteorologists leaned heavily on their “analogue” method for 4and 5-day forecasts, but modified by more conventional forecasting techniques as the period ahead for the forecast became shorter, or closer and closer. The analogue method depended on finding a weather pattern in the past that resembled the pattern developing at present and studying what resulted. As preparation the “analoguers” looked at thick folios of past weather systems until they found one they liked. The two British centers, including ours at the Admiralty, had little confidence in this method, nor in forecasts more than two days ahead, except under special circumstances. For example, acceptable 3or 4-day forecasts might be appropriate if a high-pressure cell settled down over the invasion area. The forecasters might then have more confidence that it would stay in place for several days. On the other hand, the Bay of the Seine region was right on the track of moving storm centers, so the weather changed rapidly. Some of these conference discussions became nearly irreconcilable on aspects of the forecasts and even testy as personalities and viewpoints clashed.
As agreement was being reached on the weather and wind forecasts we wave forecasters would rapidly prepare our forecasts. We did not have time to run down the hall to our office and mull over the wording of our wave forecasts so we handed a slip of paper to the Admiralty duty meteorologist with our wave forecast scribbled upon it, and he would pass it along over the phone at the end of the weather forecast.
We adapted several of the Sverdrup-Munk nomograms to our specific needs in forecasting wind waves and surf for the Normandy beaches. Particularly useful were surf-forecasting diagrams that we designed as described below. During April and May we struggled to improve our wave forecasting methods, and to develop techniques so that we could do this quickly and accurately as the meteorologists arrived at their wind forecasts. We drew up special diagrams for the invasion beaches so that we could rapidly plug in values of wind velocity, duration, fetch, and direction (Fig. 4.4, for Utah Beach; see Bates, 1949, Fig. 4.5 for Omaha). During the stages of the weather discussions concerning winds, we would study our diagrams, and settle on the wording of our forecasts when we were called upon at the end of the conference.
Our surf prediction diagrams (Fig. 4.4) consist of three sectors:
1) Polar or fetch-duration diagram in the upper part of the diagram. This diagram consists of radial lines to indicate wind direction and the concentric circles to indicate duration. The heavy lines denote, for different wind speeds, the maximum duration for a wind from that direction. This is the length of time required for a given wind from that direction to raise maximum waves. The dashed parts of these curves relate to indirect fetches, that is, areas of open water from which waves may reach the beach by refraction and diffraction around protecting headlands.
2) Wave height diagram, on the lower left. In this, the curves indicate the wave heights to be expected in deep water for winds of given speed and duration. The vertical lines of this plot are joined to the concentric circles in the polar diagram, and
3) Correction factors. These factors consist of percentages entered in the margin of each sector of the polar diagram. They show the reduction percentage to be applied to the height determined from the wave height diagram to obtain the predicted breaker height. In estimating these factors such things as shoaling water effects, refraction, and diffraction were taken into account. The reduction percentages are greater for waves approaching the beach at an angle.
Considerable judgment was therefore required at this stage of the procedure. Inasmuch as we had followed the meteorological discussions we had a real feeling for the accuracy of the forecasts as they affected the all-important wind forecasts. Our surf and other wave forecasts were definitely dependent upon wind forecasts.
By the end of May (5 days before the planned invasion) we three were fairly adept at arriving at our forecasts quickly. We got very little verification of their accuracy, however, although rare reports came in now and then from small crafts at sea and reconnaissance air flights. Our most difficult times came as a cold front approached Normandy during the first few days of June 1944. The difficulties and uncertainties were faced more by the duty meteorologists than by us, however. Although we were dependent on the wind forecasts and needed to adhere to them, we could lean slightly one way or the other depending upon our own judgment of their bearing on the wave forecast. It was a time of emotional strain upon all of us. Two swell forecasters needed to be on duty every six hours so one of us at a time crawled into a bunk now and then in a darkened sleeping room down the hall from the Met Centre to catch a few winks of sleep. Most of the slumbering forecasters were avid smokers, and the ventilation very poor, so it was difficult for me as a non-smoker to drift off to deep and decent sleep. Here I reproduce three weather maps from Stagg (1971, Figs. 5, 6, 7) (Fig. 4.5). The 4 June map applies to the weather situation about 6 hours before the final “Go or No-go” decision. Note the complex lowpressure area centered between Iceland and Scotland with a cold front reaching southward. All data and experience of the forecasters were brought to bear on whether the low-pressure area would move eastward or northeastward into Scandinavia, and when the cold front would pass over the invasion beaches. The forecasts called for the front to pass over the beaches on 4 and 5 June, so General Eisenhower postponed the assault by one day, to 6 June. Indeed, the front did pass over the beaches as predicted. The prime questions debated after that were then: Would the high-pressure ridge, extending from the Azores region into France, creep northward or northwestward and bring an interval of good weather to the landing sites by 6 June? How long would this interval of good weather last before unsettled conditions took over again? The map for 6 June (Fig. 4.5C), about 7 hours after the initial landings, shows that a bulge from the high-pressure area reached northward to the beaches and brought relatively good weather for about a day. This was followed by poor weather as the tail end of the warm front reaching southeastward from the low over southern Greenland swept across the landing sites.
Tables 4.1 and 4.2 show some examples of our forecasts. Note that all are for five days ahead, broken down into daily intervals, concerned with:
1) swell in the western approaches to the English Channel,
2) to the sea offshore of the beaches, and
3) to surf on the beaches.
In retrospect, the weather forecasts on D-Day were reasonably accurate (Stagg, 1971, p. 122-128). In regard to sea, swell, and surf, Lieutenant D. W. Pritchard, USA AF weather officer, combed through wave reports from D-Day invasion ships and beaches afterwards and he had gone ashore himself at noon. The first landings at Omaha Beach were at about 6:30 a.m. upon a rising tide, where the lowest tide occurred at 5:25 a.m. Pritchard also included reports from another meteorologist who landed at 0200 hours on 6 June. Pritchard wrote (1944):
“The early hours of 6 June 1944 found a gusty 12–18 knot wind blowing from the northwest. Wind waves in the embarking area some 10 miles off shore were average 3–4 feet with occasional interference waves as high as 6 feet. The height of the breakers on Omaha Beach during the initial landings was reported as between 3 and 4 feet. The short period of these waves made transfer of personnel and equipment from larger ships to landing craft difficult. At 0800 hours 6 June only slight breakers of less than two feet were observed on Utah, though with the wind from the northwest it is to be expected that the moderate surf of 3–4 feet as reported would be found on Omaha.
“At 1200 hours 6 June the wind waves one to two miles off Omaha were recorded at 3–4 feet of extremely choppy water with many whitecaps. The wind continued 12–18 knots from the north west, of a gusty nature reaching 20 knots occasionally. A weather officer landing at 1500 hours 6 June on Omaha reported the surf to be less than three feet high. Ship reports just east of Omaha for the afternoon of 6 June give average three feet maximum four feet waves. “The wind continued 12–18 knots from the northwest throughout early morning of 7 June and the waves continued 3–4 feet of a choppy nature, with one ship reporting average 3 feet, maximum 5 feet at 0600 hours 7 June.
“During the afternoon of 7 June the wind, though continuing from the northwest, dropped in speed to 5–10 knots and the wind waves dropped to a recorded 2–3 feet by 1800 hours. The surf became 1–2 feet by 1800 hours. This condition continued throughout the evening of 7 June.” (After the war Pritchard became the founding director of the Chesapeake Bay Institute of Johns Hopkins University).
In summary, our D-Day surf forecasts made by the Swell Section in London for two days ahead predicted “3–4 feet except for 2–3 feet in southwestern Bay of the Seine” and is verified by Pritchard’s summary of “3–4 feet at Omaha” and “less than 2 feet at Utah”. For forecasts made one day ahead the surf heights were predicted at “2 feet”. This is verified by Pritchard’s statement of “breakers at less than 2 feet observed at Utah” but not by 3–4 foot waves observed at Omaha. Our forecast was therefore a bit low for Omaha Beach and verified for Utah. It is unwise to make these comparisons strictly, however, in view of the many variables entering into the forecasts as well as the differences in time and place of the later observations. In looking at the forecasts now, 67 years after the invasion, I consider our forecasts as adequately verified.
Eisenhower was correct in making his decision to postpone the invasion by one day from 5 June to 6 June. German reports from papers recovered after the war show that Rommel and his staff had decided that the Allies would not land during this stormy interval (Eisenhower, 1948, p. 249 ff). As a result, Rommel went off to visit his wife and report to Hitler and placed his Normandy troops on subdued alert. Eisenhower took advantage of the short window of good weather forecasted between times of unsettled weather.
If Eisenhower had called off the invasion for 6 June, he would have postponed it for two weeks, to the next time the tide and moon positions were appropriate and this would have been at the time of the “Big Storm” when any landings would have faced disaster. The Big Storm wreaked havoc on the Normandy beachhead between 19 and 22 June 1944, beginning 13 days after the initial landings. At the time of the Big Storm long wind fetches in the North Sea accompanied by strong winds sent high waves toward the SSW directly onto the invasion beaches. A high-pressure ridge settled over eastern England with a steep pressure gradient falling off over the North Sea area. Very strong winds from the north and NNE resulted, and high waves roared through the Straits of Dover, aimed straight toward the area of supply build-up area at the beaches in the Bay of the Seine. This meteorological development was not completely anticipated by the Allied weather forecasters and one of the major convoys carrying much heavy equipment and many men was given the “goahead” just before the storm. As it developed, however, the meteorologists, including us, became alarmed and we sent out a special wave forecast (Table 4.4). This special warning was sent to officers in charge of unloading supplies at the beachhead, but not in time to be of real help. There was not enough warning for anchored ships or those within the artificial harbor or those tied to the breakwaters to pull out to the open sea, or to rush to English ports. The damage done by the Big Storm was very severe, as shown by the illustrations in (Figs. 4.6 & 4.7). If General Rommel’s weather advisors had forecasted the storm, the Germans might well have attacked the Allies at the beachhead and repelled the invasion. The special forecast and later ones included with the SHAEF weather forecasts were useful more in speeding up the cleanup and getting on with the onshore flow of supplies than in giving an advance warning.
The relationship between wave heights at the beaches and the tonnage of supplies brought ashore are shown in the graphs (Fig. 4.8). During much of the summer of 1944, most of the supplies needed to support the Allied invasion came across the beaches. The harbors between Cherbourg and Antwerp were out of action as the result of destruction of port facilities by the Germans. Probably the German advance planners considered it unlikely that the Allies could launch the invasion without the use of harbors. They did not foresee the Allied ingenuity in designing and constructing breakwaters and artificial harbors. The early decision by the Allied military planners to land personnel and supplies across beaches rather than to capture ports and restore them to usefulness was critical to the success of Operation Overlord.
The use of the artificial harbors did not end until mid-November. In a letter, dated August 14, 1944, Major General C. R. Moore, U.S. Army Chief Engineer, to the Commanding General, Ninth Air Force, commended the Air Corps oceanographic meteorologists for helpful wave and beach-condition forecasts during the beachhead operations. Especially appreciated were forecasts by Lieutenants Donald W. Pritchard and Robert O. Reid in charge of mobile weather stations located right on the landing beaches. A diagram we sent to the Army Engineers responsible for the transfer of supplies across the beaches is included here but we have no good evidence that it was ever used (Fig. 4.9). This Beach Room Diagram nicely reviews, however, the many factors needing consideration during an assault and equipment build-up. Some of these factors are known well ahead of time, such as the timing and range of tides, an approximation of beach profiles, and perhaps the position of beach obstacles. This part of the diagram could be printed a few days ahead but weather and wave information could not be plotted until about two days ahead at the earliest. The diagram is a timespace sketch showing the position of the strand line as the tide goes in and out, where surf would form, and how high the surf is expected. Note the effect of bars and runnels (irregular depressions between bars and shore). Our original plan was for one of these diagrams to be issued for each 24-hour day. The weather and wave forecast would include wind speeds and their directions, horizontal visibility in miles, smoke-laying conditions, cloud cover, and rain. The diagram applies to conditions at the beach and immediate surroundings, and not to weather affecting parachuting and glider landings, nor bombing or naval shelling at distances inland from the beach.
From time to time, depending on the strength of waves and longshore currents, and their persistence, sandbars and runnels would form. The combination of a bar with a runnel just shoreward posed a special hazard. Consider the consternation and dismay if a landing craft, such as an LSVP (landing ship, vehicle and personnel), grounded on a sandbar in water about three feet deep. Troops under fire and overburdened with huge packs and carrying guns and ammunition would first wade into water waist deep and then would need to cross a runnel where the water was three feet deeper! A soldier hunkered to about five feet in height is in real trouble in trying to walk through water six feet deep!
Some characteristics of the two American beaches are shown in Table 4.4. Folios distributed before the invasion included large-scale maps of the beaches and showed seawalls, rocks at the ends, beach exits,
etc.Bates and I visited the beaches in July, each for a week separately when unloading operations were in full swing. One of us needed to remain in London to work with Cauthery on forecasts by the Swell Forecast Section. The trips afforded us an opportunity to view areas we had come to know well from our dungeon-like warren below ground in London. I made my trip from 19 to 26 July and Bates from 27 July to 7 August.1
1 When the war was over, and we were waiting in Manila to return “stateside,” the differences in dates of our Normandy trips turned out to be of some significance! The Army awarded me a “battle star” to wear among my decorations because I spent my week in Normandy just before the Army‘s cut-off date for this campaign award. Bates, however, did not qualify. This might have been important because the order of discharge home depended on the number of “points” received in service, and a battle star counted as five points. Neither of us had fired a gun during the Normandy invasion and yet I got credit for the same service as a soldier storming ashore on D-Day! Fortunately neither of us actually needed the five points and we were both sent home quickly when the war ended. Moreover, we were both awarded Bronze Star Medals for our invasion service, a medal that brought us each 5 points in addition. Upon arriving at the airstrip in Normandy in July 1944, I reported to the nearby weather station, manned by several weather officers including Pritchard and Reid. In addition I had technical discussions with Colonel Moorman and others concerning oceanographic forecasts and I drove with one of the officers along many stretches of the invasion beaches from Utah to Gold, and to Cherbourg. Damage to the fabricated breakwaters (Gooseberries) and artificial harbors (Mulberries) was still obvious although they had been partly repaired and supplies were coming ashore.
I spent my first night unpleasantly, much like an infantry soldier. It was raining and I was assigned a foxhole in an apple orchard not far from the airstrip and weather station, huddled beneath a couple of damp blankets below a leaking ground cloth. From time to time I would bail water from a hollow in the floor of the trench using my canteen cup as a bailer. During the night an air alarm sounded accompanied by a great clatter of antiaircraft guns. In the morning I learned that a German reconnaissance plane had been caught snooping above us and was shot down somewhere in the distance.
On my jeep trip to Cherbourg we stopped to examine a huge German gun emplacement made of thick reinforced concrete but now full of holes from Allied naval bombardment. We cautiously approached it and peeked into it through a gun port, well aware of the chance of stepping on a land mine and very careful that we did not. We got close enough to pick up the reek of decaying human flesh. At Cherbourg, although under Allied control but not yet operational as a port, I made arrangements for sending wave observations to London. A huge invasion such as Operation Overlord would not be possible now in 2011. If satellites, such as those crowding space today, had existed then, the images from space would have seen the stream of ships on their way to Normandy. The Allies had complete control of the air in 1944, so that German reconnaissance planes were unable to observe the fleets converging on the landing beaches. Some convoys spent two days in making their way southward from Scotland, and others assembled in harbors crowded with ships and landing craft along the English coast.
Times in London
Both before and after the invasion my times in London consisted of hard work and long hours interspersed infrequently by pleasant episodes of relaxation. During the ‘buzz-bombing’ before and after the invasion we could not hear them flying overhead from the depths of our Swell Forecast Section office several floors beneath the ground. When we came out of our dungeon for lunch or in the evenings we could hear them clearly, especially if they were close by. As a buzz bomb flew overhead across London, one listened carefully and mentally plotted its course to see whether it might pass directly overhead or to one side. If their motors cut out, they glided downward for their strike. If they seemed to be headed right for you, you quickly jumped into any kind of nearby shelter. Many landed close at hand but none of our group was injured.
Our wave forecasting services for Operation Overlord came to an end in mid-November when the unloading of men and equipment across the beaches ceased. Several harbors along the English Channel coast of France were operational again. We then wrote a report on what we had learned. When we were finished, a buzz bomb landed on the plant where our report was being reproduced and our original copy was destroyed. Fortunately we were able to assemble a duplicate that in time was mimeographed (Swell Forecast Section, 1944).
The V-2 rocket missiles were especially scary and did great damage to areas at and near their impacts. One lunchtime, while walking across St. James’s Park, we heard a tremendous explosion a few miles to the west followed by the sound of the rocket as it approached, since the V-2s flew faster than sound. One night, while fast asleep, a bomb landed about a block from my billet. I woke up on the floor, perhaps knocked out of bed or perhaps I was so startled from my sleep that I jumped or fell out. In the morning, I noted no significant damage to the immediately adjacent buildings but severe damage had been done about a block away.
For a month or so I lived in a garret room on the top floor of a decrepit building at Shepherd Market, Mayfair. The building next door had been bombed out early in the war, and the wall of my building was partly supported by buttressing beams from the ruins. The officer in charge of billeting told me that no officer had been willing to live there but it was within comfortable walking distance of the Admiralty so I took it. I rigged up a hooded desk lamp on a box between an old stuffed easy chair and my bed so that I could read comfortably. There were many mice about, and during the darkness of night with my reading light turned off I could hear them scuttling here and there as I drifted off to sleep. In the morning, crackers I had left close by had been nibbled or carried away. On several nights I put some enticing cookies and cheese chunks on an upside down metal wastebasket next to my bed, put on some gloves, and lay down with my hand on the light switch with the light aimed directly downward to where I expected mice to come scrounging. In a few moments I heard a mouse scratching among the goodies. Quietly and quickly I turned on the light and it beamed down brilliantly upon the mouse. The startled mouse stood up on its hind legs and I grabbed it quickly and threw it out the open window. Presumably it fell for six floors. While asleep I was never awakened by a mouse scurrying about within the blankets of my bed.
A group of us from the Met Centre usually wandered to a restaurant for lunch in the Soho and Leicester Square area. The conversation with colleagues was refreshing and relaxing but we never talked about our war activities. We were all carrying high security classifications and instinctively avoided anything pertaining to what we were doing. Despite wartime shortages, the food in these restaurants was quite enjoyable and omelets concocted from dried eggs were delicious and popular. We very much enjoyed lunches at Pinoli’s.
Especially appreciated were the American Red Cross clubs, where good meals were served and there was a comfortable lounge with adequate reading lights and many magazines. Lunchtime walks and those to and from my billet in the evenings provided both needed exercise and familiarized me with the center of London from the Thames River on westward through Westminster, Whitehall, St. James’s Park, Green Park, and Mayfair. England was on double daylight time, so the summer evenings were quite bright until nearly midnight. I walked many miles during July and August, after wave forecasts for the Normandy beaches were no longer so critical and only one of us was needed as the duty wave forecaster. At these times we arranged a schedule so that we each had a full day off each week. I went to many famous places reachable by public transportation and recall admiring Kew Gardens, St. Paul’s Cathedral, strolling through museums open during wartime, a day at Greenwich, and other renowned places.
One foggy and drizzly evening Bates and I strolled into Westminster Abbey. We wandered about reverently, studying the graves of British notables when an elderly cleric asked if we had questions. After chatting quietly for a few moments he invited us through private doors into a part of the abbey normally closed to wandering soldiers. We climbed a worn stairway up the middle of a wide column to a small balcony looking out into a chapel where many ancient English kings were buried. He explained that this time in the evening was the very best time to visit the chapel, when light through the stained glass windows gave it an ethereal glow. We also strolled through cloistered courtyards where monks had wandered in the past. A servant came up to him, stating: “Sir, your car is waiting.” He drifted away, and we asked the messenger who the cleric was—the Dean of Westminster Abbey himself.
American officers tried to get at least one meal a day at the U.S. Army mess near Grosvenor Square. Here the food was much better than that available to British citizens, both in quality and quantity, but only officers in American uniforms were admitted except by special arrangement. We paid in British cash from our per diem allowance. On Audley Street, however, there was a U.S. military restaurant where we could take guests for a good meal. We invited several of our close British friends and their wives for dinners here, and it was obvious that they enjoyed the good food with lots of it.
One morning in early February, as the military organization for the planned invasion was getting under way, I had an appointment with a Brigadier General in the main headquarters building on Grosvernor Square. As a mere lieutenant I made certain that I knew exactly where his office was located. Protocol demanded that I rap on his door at exactly the time of my appointment, neither too early nor too late. As I waited for the exact moment, I faced the wall in the hallway scanning a bulletin board. A voice behind me said, “Lieutenant, where‘s the men’s room?”
I turned around and saw that the question came from a general wearing a galaxy of stars and decorations: he was General Eisenhower. I “popped-to” and saluted and stammered a reply. This was one time during the war when I knew exactly what to say! I had been to the restroom just a few moments before. As a weather and wave forecaster I was conditioned to always reflect for a moment before answering any direct question. It was usually prudent to furrow one’s brow, appear pensive, and word any reply very carefully. This time I could be precise.
During a rainy spell a few days before the landings Bates and I stepped from the Underground out upon the sidewalk as we went to lunch. At the moment a rain shower had passed and it was sunny. As we started to cross the street two enlisted military policemen came up to us, saluted, and said, “Sirs, the general notes that you two lieutenants are out of uniform. Remove your rain caps when it is not raining.”
In walking about the streets of London we always wore officer’s hats, but when raining, covered them with an oil-cloth cover so that water would not seep into the fabric. We looked along the street and saw General Patton gazing at us from about a hundred yards away dressed in his trademark Eisenhower jacket. We saluted from a distance, he returned the salute, and we quickly removed the offending hat covers.
Well after the landings Bates and I were invited for an overnight stay on a weekend to the home of Lieutenant Commander G. H. T. Kimble, RNVR, who lived in Reading, about 60 km west of central London. (Kimble was a geographer who later became Executive Director of the American Geographic Society and then a distinguished professor at McGill University, Montreal, Canada). We got mixed up in the combination of Underground, railroad, and bus connections, and so arrived late. Mrs. Kimble met us at the door and showed us around their pleasant summer garden and to our room. Our relaxing stay was underway but we did not meet Kimble himself until a late dinner. He was in the habit of sequestering himself in his study to get on with his geographic writing and was not going to have his writing interrupted by guests. The next morning, a Sunday, after a leisurely and conversational breakfast, he excused himself to return to his work. He was a man with exceptional abilities to concentrate. Bates and I walked about Reading until time to take the train back to London. At home I had learned that many of my Crowell ancestors had come from the Reading area, so I stepped into a phone office to look at a phone book. There was a long list of Crowells, so I did not call any; I did not know where to start!
I thoroughly enjoyed a summer afternoon “punting on the Thames” with the Burgess family. Mrs. Burgess brought along a picnic basket and from a dock near Maindenhead we punted along backwaters of the river, gliding beneath hanging willows with duck families swimming along with us. It was summer so all was very green. Their two comely teenage daughters, Lorna and Catherine, were all aglow with the outing. At dark, we glided to the dock, walked a few blocks to the home of Mrs. Burgess’s sister for a late supper, and then I took a train back to London.
On another outing, Burgess, his wife, and I cycled along narrow English lanes near their home. Upon our return I was most embarrassed to find that my heaviness had bent the seat support on the borrowed bike I was riding. It would have to be replaced, a difficult repair to make in wartime England. Despite my lengthy entreaties Burgess would not think of my paying for the repairs.
Between mid-October and mid-November, after we had completed our final report of the Swell Forecast Section, Bates and I were ordered back to the U.S. to learn results of wave research during the past year, and to discuss future plans for us. Upon arrival in Washington we visited many officers: U.S. Navy, U.S. Army Air Corps, and British Liaison officers. Captain Garbett, RN, in charge of the RN Meteorological Service and our work in the Admiralty, was planning to send the Swell Forecast Section to Ceylon. It was to be assigned to Admiral Mountbatten’s command in planning for the invasion of Burma. Garbett had requested that Bates, Lochner, and I remain with the Swell Forecast Section in this new assignment. He also thought that “all would be more comfortable” if we were transferred from the U.S. Army to the U.S. Navy and wore blue uniforms rather than Army khakis. He therefore wrote several letters to RN Liaison officers in Washington and to friends in the U.S. Navy. Nothing came of this gambit, however, although we discussed the prospect with several officers in Washington, both American and British. We had rather enjoyed our uniqueness in London, where as U.S. Army officers in khaki we stood out within a sea of blue naval uniforms. We were skeptical that such a transfer could be arranged easily, and we certainly did not relish the prospect of being sent through a U.S. Navy officer-training course. Nothing came of this proposal, however, and we never learned just how high it had worked its way up the U.S. military structure. Perhaps planners in the Army Air Corps already suspected that we might be useful in the Pacific as Army officers. We remained in our khaki uniforms until the end of the war.
In Washington we briefed the USN Hydrographer, the chief USN aerologist, and the chief of Special Studies in the Weather Division of the Air Corps on what we had done during the Normandy invasion and our views of continuing such a service for other landing operations. We stressed that we wished to collect information on wave research underway in the U.S. during the past year in preparation for our new assignment in Ceylon, so introductions to persons here and there were authorized and arranged. We especially profited from long conversations with Lieutenant Commander Roger Revelle, USNR, whom we worked with later in Manila. (Revelle became a founding father of the University of California at San Diego after the war and earned distinction as a director of the Scripps Institution of Oceanography). We met Commander R. C. Steere, USN, whom we had known in London as the USN staff aerologist during the Normandy invasion and who was now assigned to the Office of Chief of Naval Operations. These conversations, as well as those with several other officers and civilian scientists and engineers were largely focused on the need for better wave observations at critical localities.
Research in the U.S. was underway on instruments placed on the sea floor within or near the breaker zone, hopefully where reliable measurements of wave height and period could be sent automatically to weather stations ashore, perhaps through a cable through the surf zone. Some instruments relied on changes in water pressure as a wave train passed by overhead but the war ended before many were deployed. We were also interested in “reversed echo sounders,” or instruments placed on the sea floor that would reveal a profile of the waves above in much the same way as echo sounders in ships make a profile of the sea bottom. Discussion also focused on methods of measuring wave parameters from aircraft, such as by radio-altimeters and through the interpretation of aerial photographs.
At Woods Hole Oceanographic Institution, Massachusetts, we had long discussions concerning research on wave observation techniques and weather forecasting in the tropics. Our next assignment in Ceylon would involve forecasting where monsoon systems predominated and where typhoons were a threat. All persons were most helpful. Dr. Maurice Ewing, in charge of a lab constructing wave recorders, was exceptionally busy and could not schedule a long discussion. He learned, however, that we were scheduled to take the same train as he from Woods Hole back to Boston to catch a plane to Washington and suggested that we hold a wave conference in a quiet corner of the railroad car during the journey. This was a good way to schedule an uninterrupted visit with a very busy man. (Years later, when I was on the faculty at UCLA, I sat with him at lunch during a geophysical meeting. He only recalled that he had discussed waves with Air Corps officers on the trip but he did not recognize me in civilian dress.)
We next crossed the country to Scripps at La Jolla, California. On the way Bates dropped by to discuss tropical meteorology in the Indian Ocean region with our former professors at the University of Chicago and unofficially to steal a few days leave with his wife Bartie. I traveled to La Jolla by way of Austin, Texas, for a stolen four days at my aunt’s home. My parents were spending a sabbatical leave in Mexico City so they came north by train for our visit.
At Scripps Bates and I discussed aspects of our wave forecasting for the invasion with Professor Sverdrup and his colleagues, and I gave a two-hour lecture on what we had learned during the Normandy landings to the incoming class of USN persons, including some experienced officers, who were just starting their oceanographic course. Although only about a year had passed since we were novices like many of those in our audience, they looked up to us with considerable deference: ”we had been there and done that.”
By fortunate coincidence a several-day conference on wave research was underway so we learned about work at Scripps, UC Berkeley, Woods Hole, and elsewhere. We felt that we were pretty much up-to-date upon our return to Britain and were prepared for our future assignment in Ceylon.
Back in England, from mid-November to early December, I made a trip to Paris and elsewhere in France. Paris was a delight and although the war was winding down (we thought) and transportation was a bit irregular, I was forced (reluctantly ?) to spend three days in the city. Cafeés and theaters were open and the Parisians were obviously enthusiastic over their liberation. The center of Paris was not damaged significantly, although buildings needed repair. Of course I attended the Folies Bergère. In riding the Metro I noticed that ladies exuded pleasant perfume odors whereas in London body smells were more likely.
At the headquarters of the U.S. Army Ninth Air Force at Chantilly, an elegant chateau northeast of Paris, I held discussions with Colonel Moorman concerning our future plans. For a few days I actually worked again as a duty weather officer just before a stagnant high-pressure cell settled over the battleground area, resulting in low-level clouds and fog and the grounding of aircraft needed in the immediately forthcoming Battle of the Bulge. As this critical battle got underway I was travelling back to Britain and preparing to go to our next assignment, to the Southeast Asia Command.
 

Table 4.1:
Wave reporting stations and invasion beaches. From Bates, 1949, Table l.

Table 4.2:
Sea and swell forecast from 5 to 8 June 1943, issued two days before 6 June invasion.

Table 4.3:
Surf forecast from 5 to 8 June 1943, issued a day before the 6 June invasion. 

Table 4.4:
Special wave forecast issued during the “Big Storm.”

Table 4.5:
Characteristics of Omaha and Utah beaches. 

Fig. 4.1:
Weather map of North Atlantic Ocean showing where strong winds raise waves in generation area with a fetch (F) aimed toward Morocco, and the decay area (D) between the edge of the generation area and the coast. Isobars over the North Atlantic on 7 November 1931 (1300 GMT) taken from the meteorological charts of the Northern Hemisphere. Redrawn from USN Hydrographic Office, Misc. 11,275, Fig. 12, 1943. 

Fig. 4.2:
Organization charts of weather centers (above) and staff weather officers (below) for Normandy invasion, June 1944. Redrawn from Bates and Fuller, 1986, Ch. 5, Fig. 3. 

Fig. 4.3:
Sea, surf, and swell observation stations on the English coast and the location of the Normandy invasion beaches. See Table 1 for location of stations, offshore forts, and invasion beaches. Inset: Bay of Seine. Redrawn from Bates, 1949, Fig. 1. 

Fig. 4.4 A:
Surf prediction diagram for Omaha Beach, reduced from Swell Forecast Section, Final Report, 1944, London, Admiralty. 

Fig. 4.4 B:
Sketch to show how the surf prediction diagram is used. Refer to text. 

Fig. 4.5:
Weather maps at time of Normandy Invasion (from Stagg, 1971, Figs. 5, 6, 7).
A: Map of 4 June 1944, 1300 GMT, about 6 hours before the “Go-No Go” decision by Eisenhower.
B: Map of 5 June 1944, 1300 GMT, and
C: Map of 6 June 1944, 1300 GMT, about 7 hours after the initial landings. Arrows point to the invasion beaches. 

Fig. 4.6 A:
Mulberries and gooseberries on Omaha Beach before the disastrous storm of 19 to 22 June 1944.

Fig. 4.6 B:
Same view as 7A showing the damage done by the storm. Figs. 4.6 and 4.7: Photographs of damage on Omaha Beach by the Big Storm of 19 to 22 June 1944. By U.S. Army Pictorial Service, ETO-HQ-44.

Fig. 4.6 C:
A pier after the storm had tossed landing craft into it.


Fig. 4.7 A:
Wrecked landing craft. Most of the damage was done by wave-tossed craft smashing into one another.

Fig. 4.7 B:
An LCT banging smaller boats to pieces midst high waves. 8C. Ferries and a petrol barge being hammered by waves.

Fig. 4.7 C:
Ferries and a petrol barge being hammered by waves.

Fig. 4.8 A:
Wave heights and tonnage of supplies unloaded across assault beaches during June 1944. From Swell Forecast Section, Admiralty, 1945.

Fig. 4.8 B:
Wave heights off Normandy coast reported during the Big Storm, 19 to 22 June 1944. Redrawn from Bates, 1949.

Fig. 4.9:
Beach room diagram. From Swell Forecast Section, Final Report, 1944.
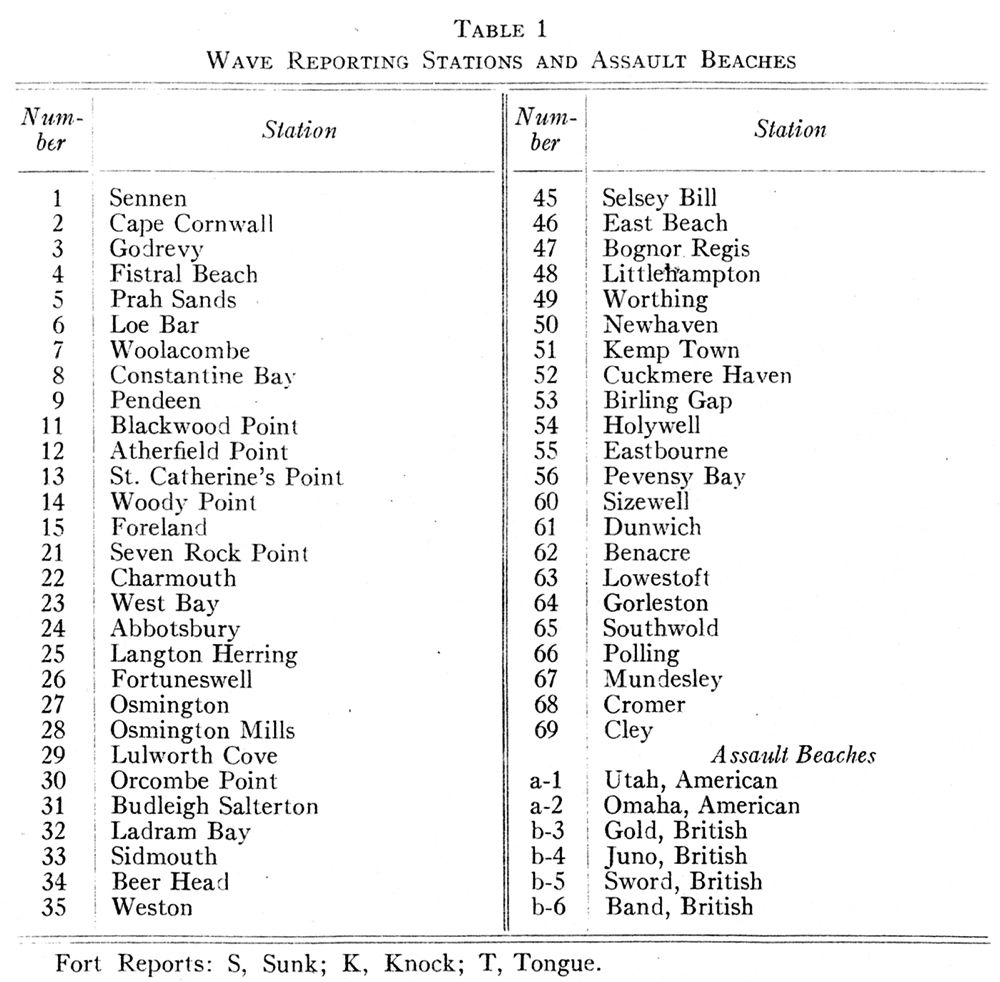
Wave reporting stations and invasion beaches. From Bates, 1949, Table l.
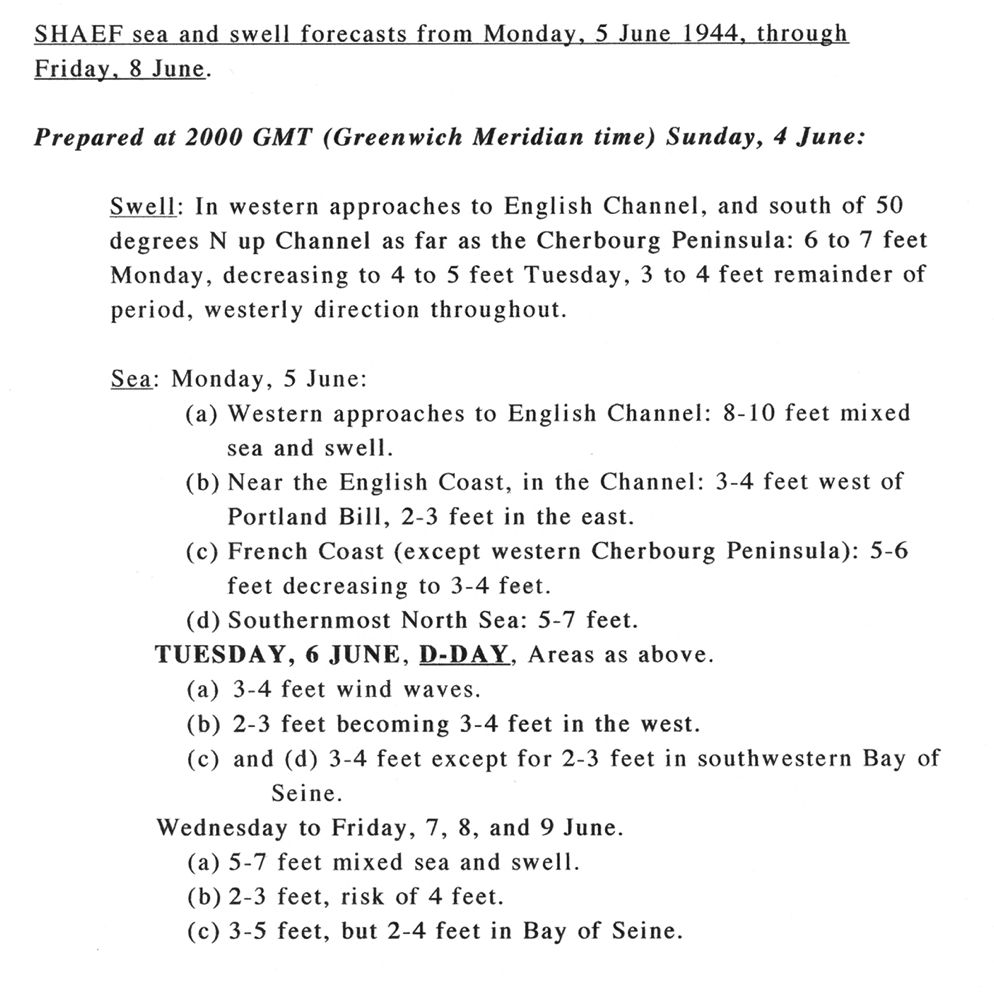
Sea and swell forecast from 5 to 8 June 1943, issued two days before 6 June invasion.
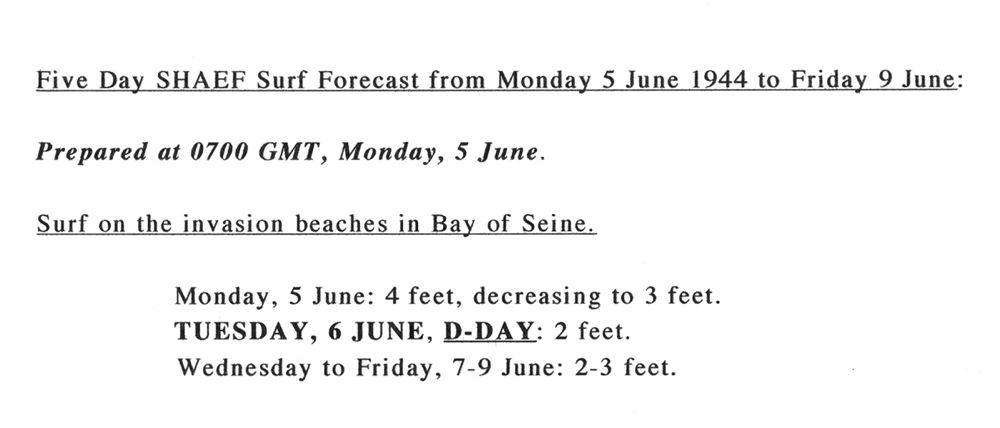
Surf forecast from 5 to 8 June 1943, issued a day before the 6 June invasion.
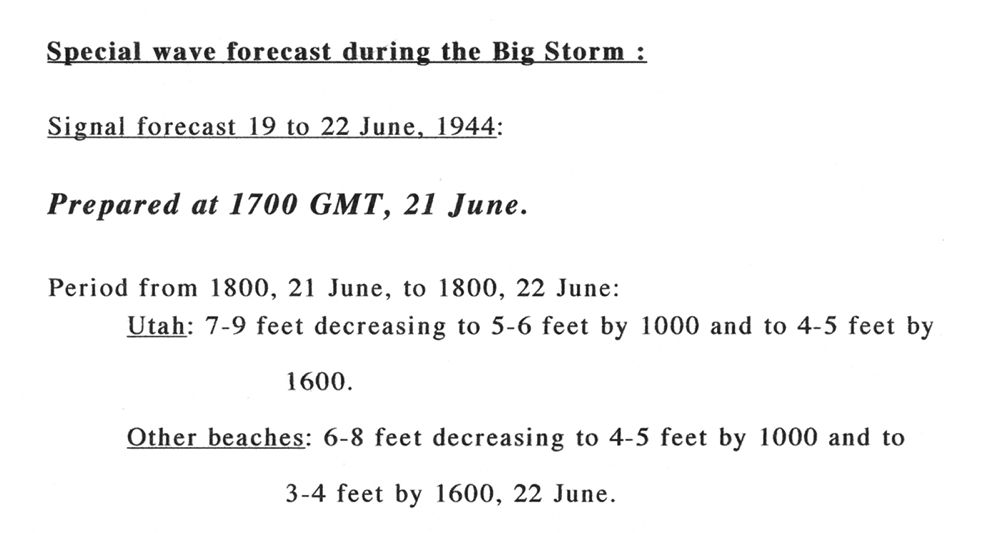
Special wave forecast issued during the “Big Storm.”

Characteristics of Omaha and Utah beaches.
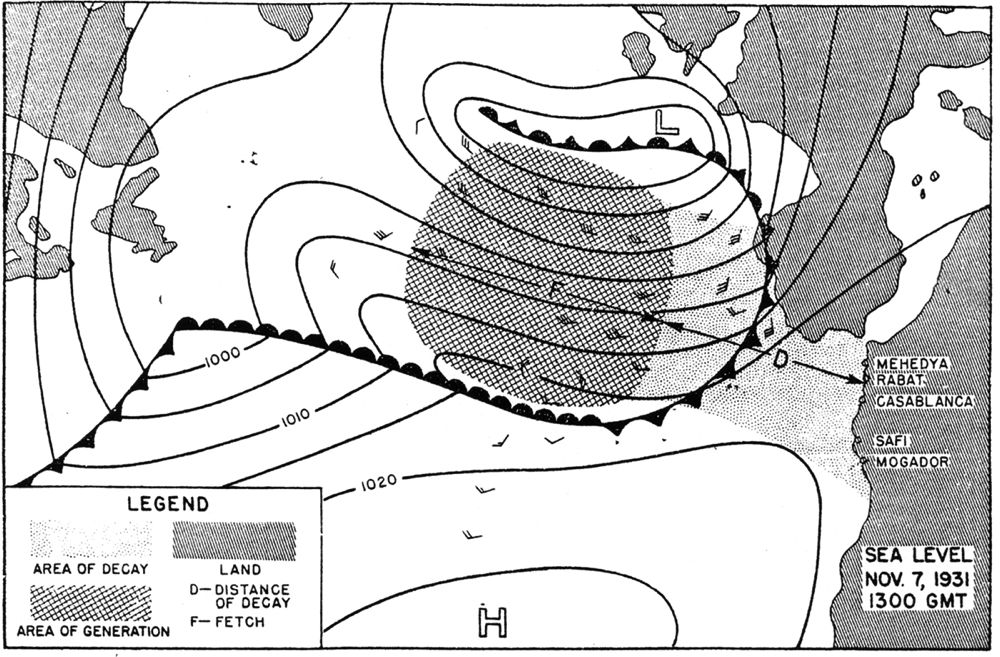
Weather map of North Atlantic Ocean showing where strong winds raise waves in generation area with a fetch (F) aimed toward Morocco, and the decay area (D) between the edge of the generation area and the coast. Isobars over the North Atlantic on 7 November 1931 (1300 GMT) taken from the meteorological charts of the Northern Hemisphere. Redrawn from USN Hydrographic Office, Misc. 11,275, Fig. 12, 1943.
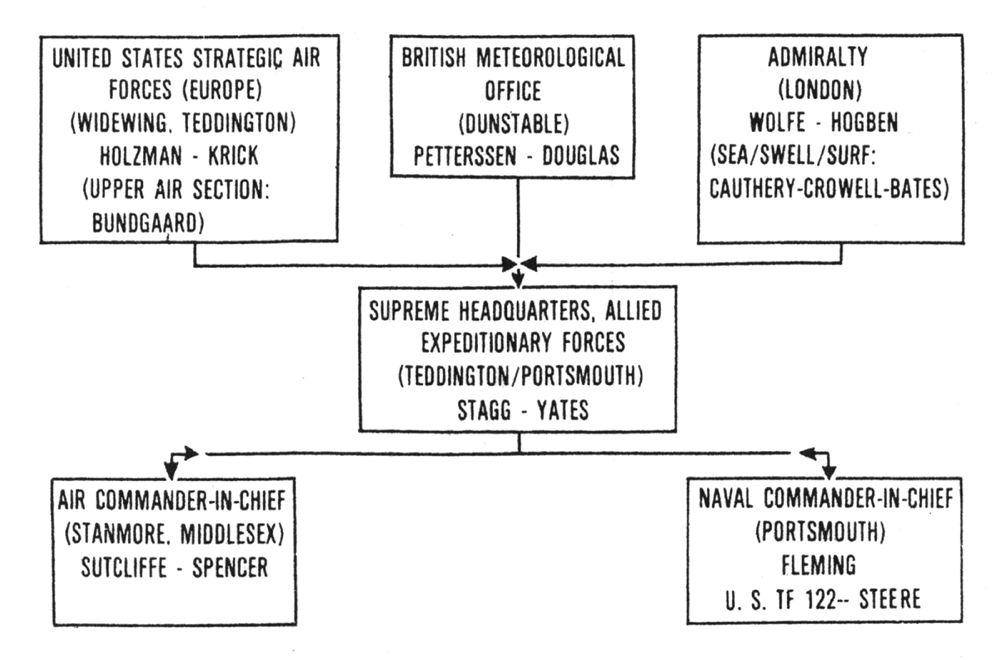
Organization charts of weather centers (above) and staff weather officers (below) for Normandy invasion, June 1944. Redrawn from Bates and Fuller, 1986, Ch. 5, Fig. 3.
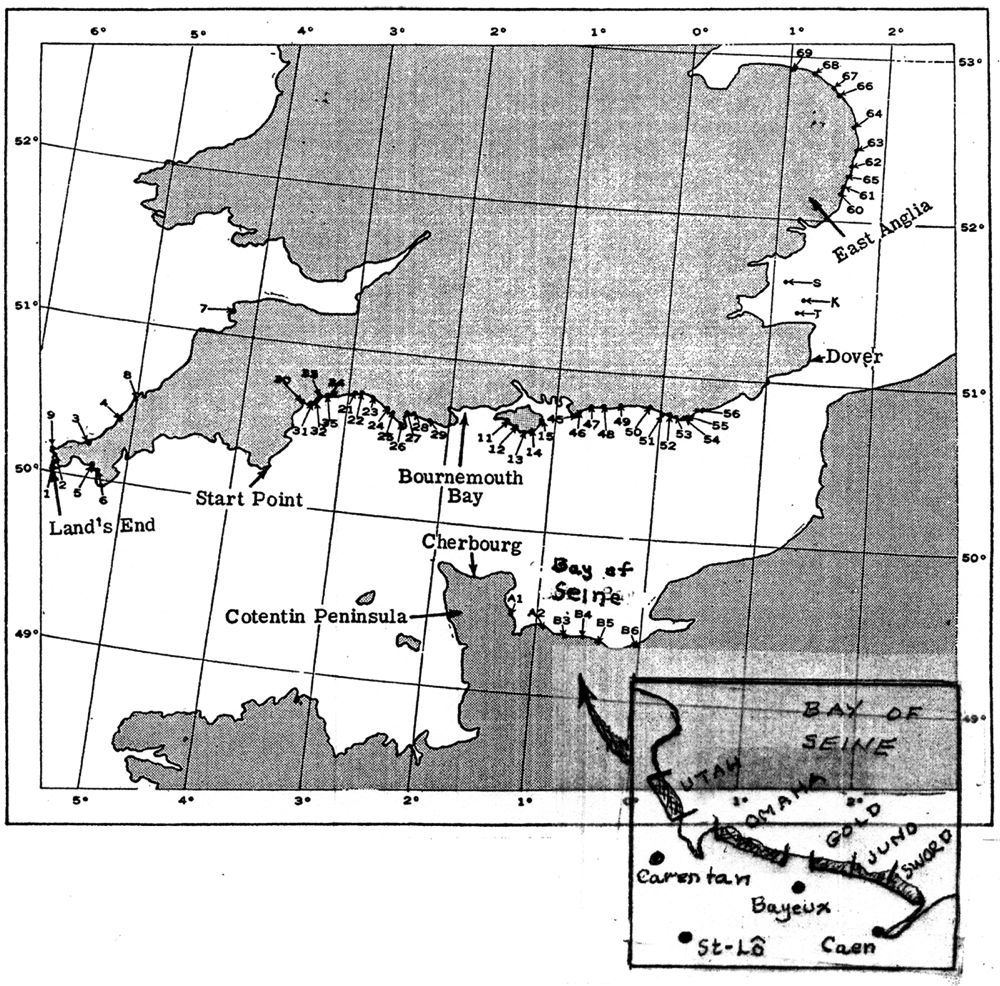
Sea, surf, and swell observation stations on the English coast and the location of the Normandy invasion beaches. See Table 1 for location of stations, offshore forts, and invasion beaches. Inset: Bay of Seine. Redrawn from Bates, 1949, Fig. 1.
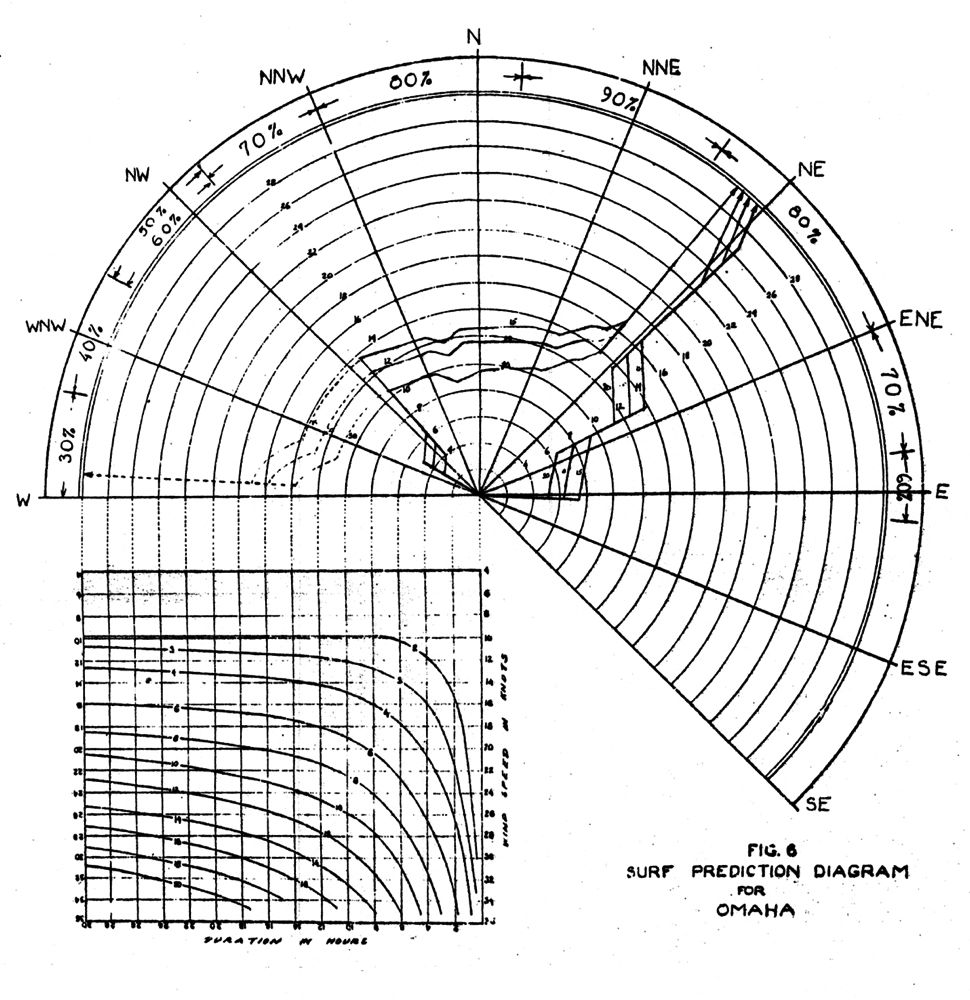
Surf prediction diagram for Omaha Beach, reduced from Swell Forecast Section, Final Report, 1944, London, Admiralty.
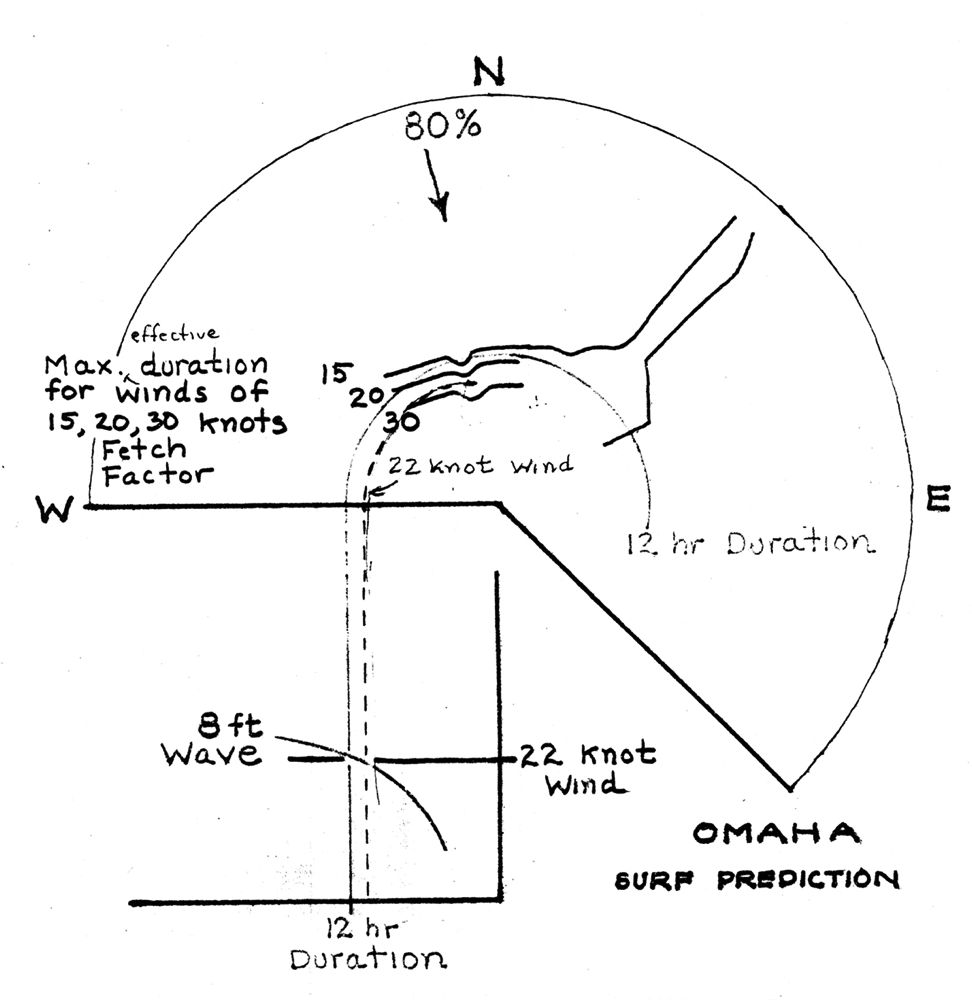
Sketch to show how the surf prediction diagram is used. Refer to text.
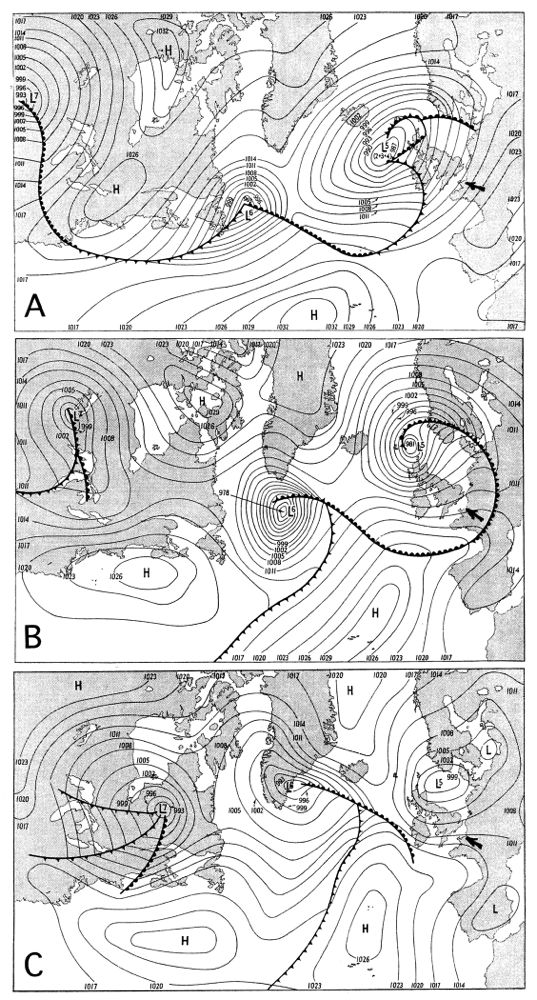
Weather maps at time of Normandy Invasion (from Stagg, 1971, Figs. 5, 6, 7).
A: Map of 4 June 1944, 1300 GMT, about 6 hours before the “Go-No Go” decision by Eisenhower.
B: Map of 5 June 1944, 1300 GMT, and
C: Map of 6 June 1944, 1300 GMT, about 7 hours after the initial landings. Arrows point to the invasion beaches.
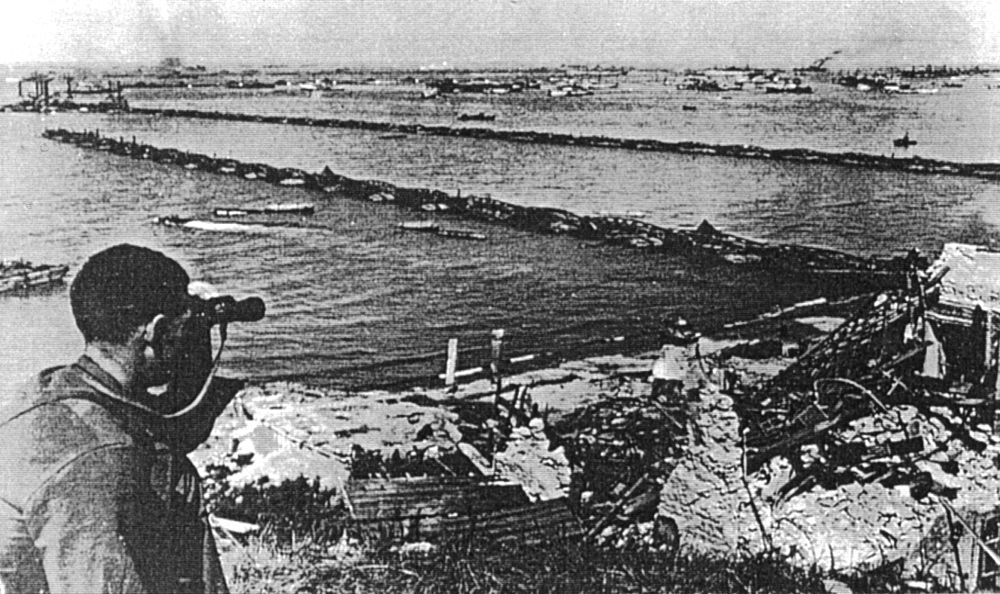
Mulberries and gooseberries on Omaha Beach before the disastrous storm of 19 to 22 June 1944.
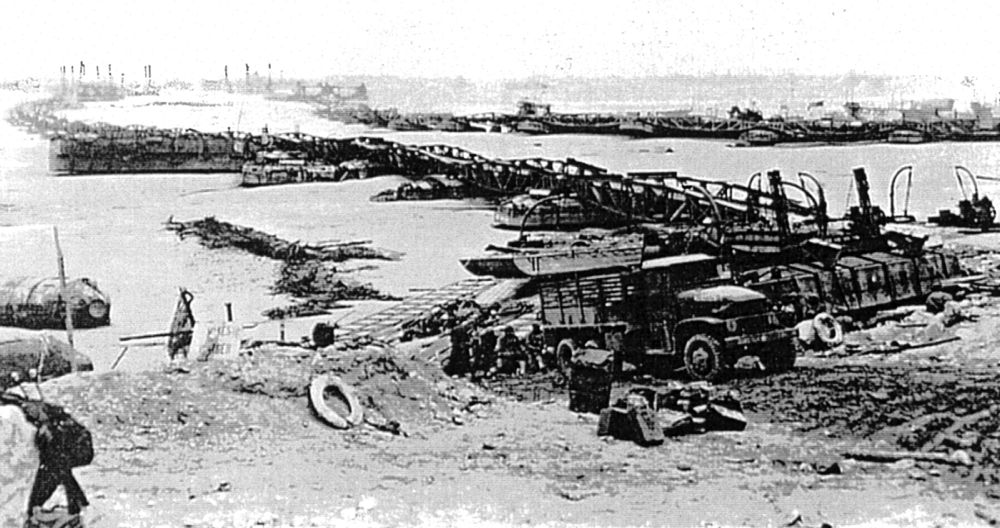
Same view as 7A showing the damage done by the storm. Figs. 4.6 and 4.7: Photographs of damage on Omaha Beach by the Big Storm of 19 to 22 June 1944. By U.S. Army Pictorial Service, ETO-HQ-44.
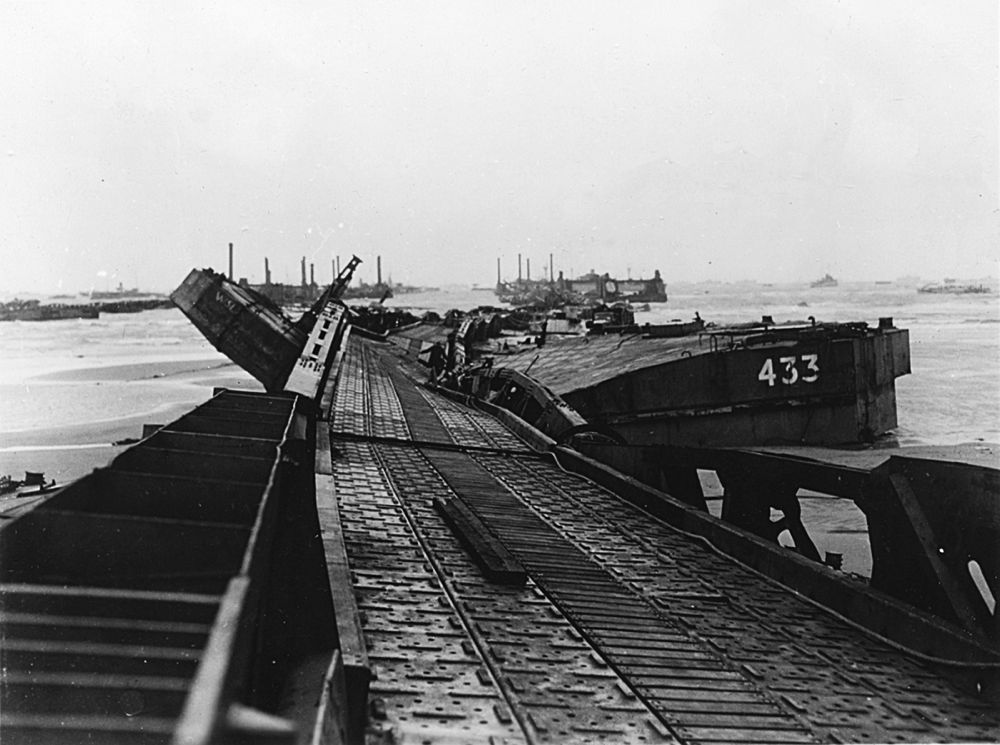
A pier after the storm had tossed landing craft into it.
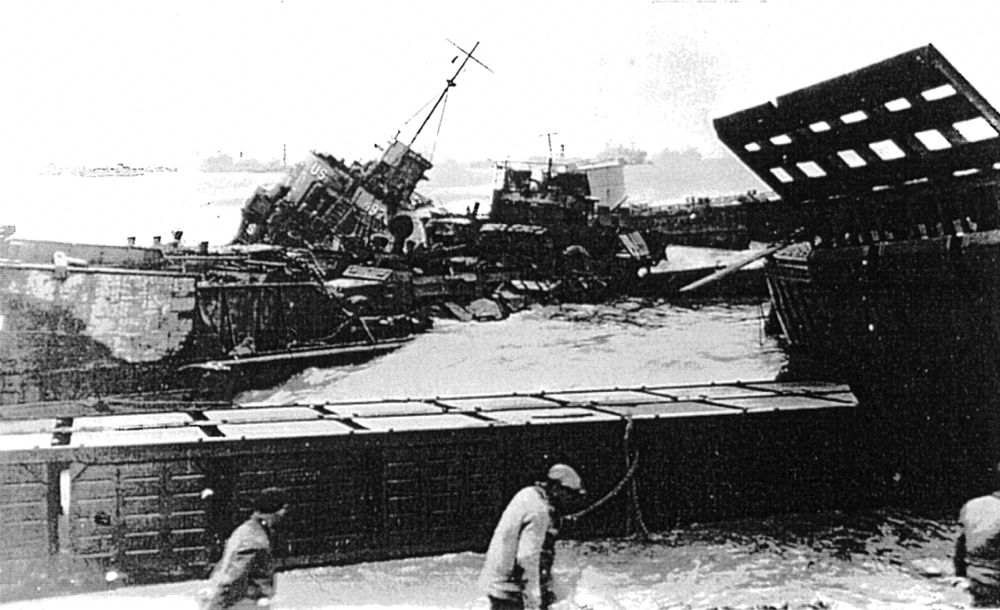
Wrecked landing craft. Most of the damage was done by wave-tossed craft smashing into one another.
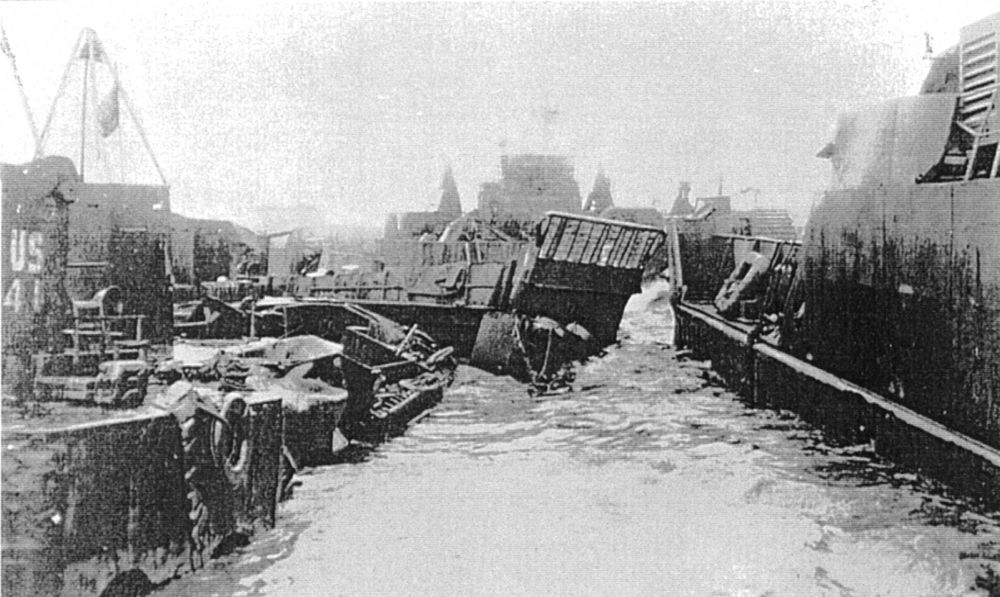
An LCT banging smaller boats to pieces midst high waves. 8C. Ferries and a petrol barge being hammered by waves.
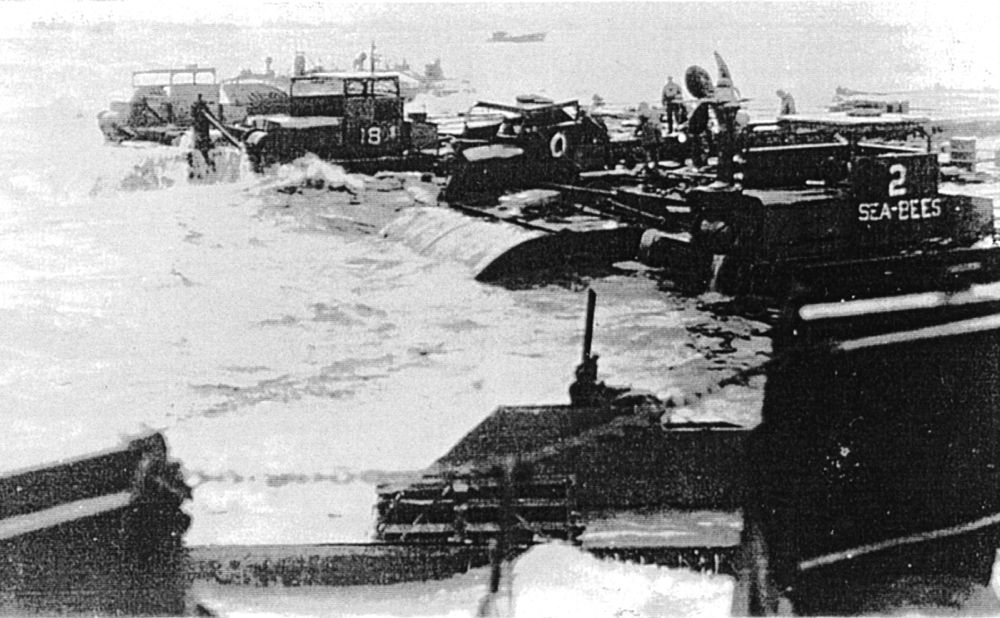
Ferries and a petrol barge being hammered by waves.
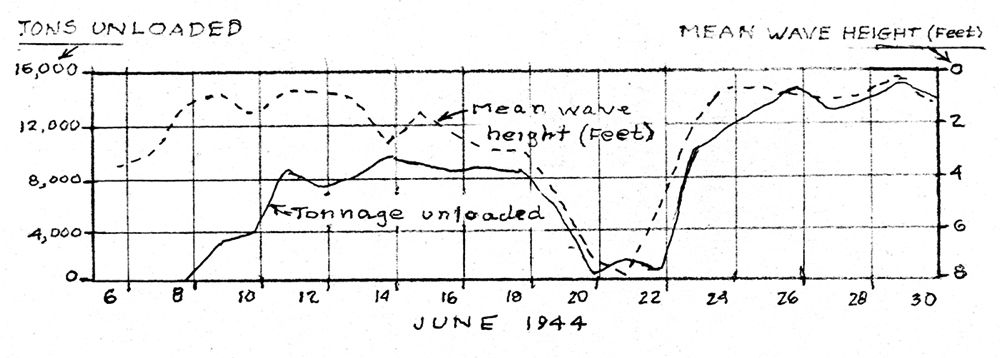
Wave heights and tonnage of supplies unloaded across assault beaches during June 1944. From Swell Forecast Section, Admiralty, 1945.
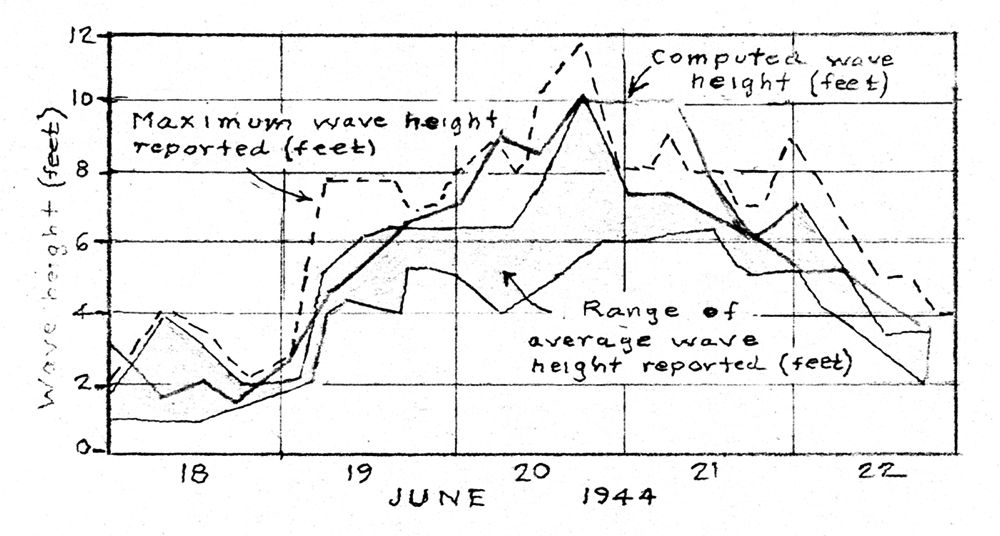
Wave heights off Normandy coast reported during the Big Storm, 19 to 22 June 1944. Redrawn from Bates, 1949.
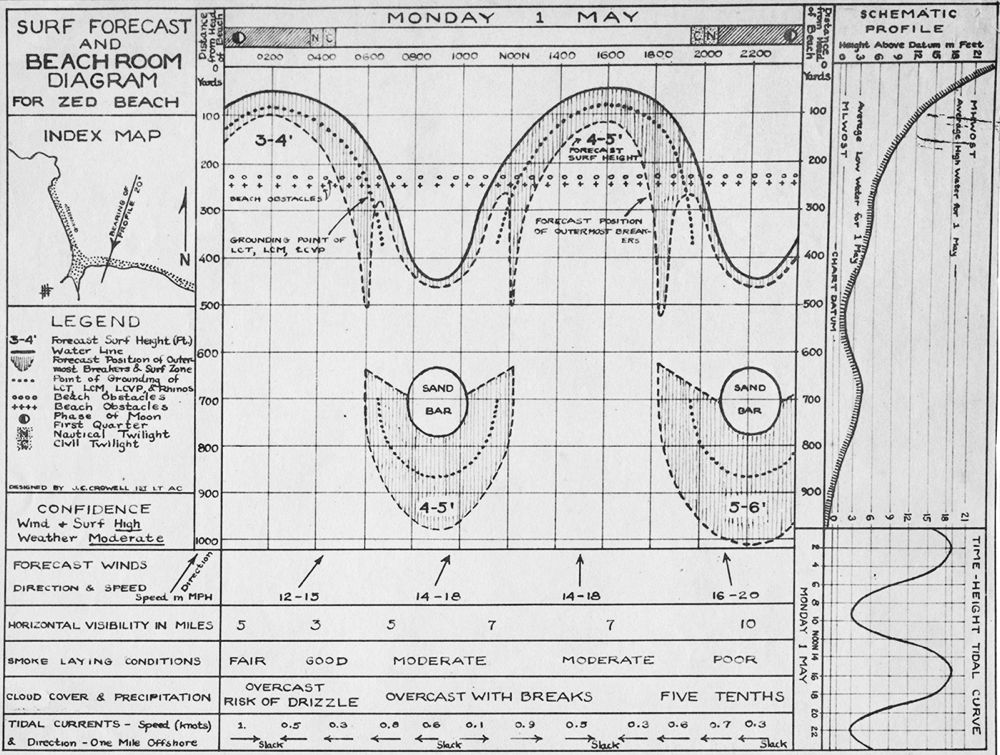
Beach room diagram. From Swell Forecast Section, Final Report, 1944.
Autobiographical sketch since World War II
Sixty-six years have now lapsed since the end of World War II and the end of my wartime story. Here I outline what I have done since then.
I returned to Scripps in October 1945 and quickly completed requirements for an M.A. degree in oceanographic meteorology and then re-enrolled for my doctorate in geology at UCLA (awarded on September 13, 1947). My dissertation involved the tectonics of the area where the San Andreas Fault meets several other major faults, including the Garlock and San Gabriel.
In early 1946 I met Betty Marie Bruner of Claremont. We married in November and remained married for 61 years until she died in Santa Barbara in 2007. We had a daughter, Marty, in 1951.
Instead of returning to the petroleum industry, we elected to follow an academic life of teaching and research, so when UCLA offered me a faculty position I accepted it. Moreover, the location of the campus allowed me to get to the San Andreas belt in a few hours. I remained at UCLA for twenty years, rising to full professor, including two terms as department chairman. This was followed by 20 years at UCSB until I “retired” at age 70 in 1997. My teaching has included large classes for general students, structural geology and tectonics for majors, and several types of field courses and seminars. As Professor Emeritus, I have continued geological writing, and offering lectures and short courses to geological organizations and universities at many venues in North and South America, Europe, Africa, Asia, and Australia.
My research, involving the mentoring of many graduate students, has dealt with the geology of southern California, the origin of submarine canyons, sedimentation and tectonics of transform belts, turbidity currents and their deposits, the distinction of glacial sediments from those of other origins, and regional studies of Scottish and Alpine stratal units. In particular I have investigated the records of ancient ice ages, as old as three billion years that are preserved locally on all continents, including Antarctica.
Recognitions that I have received include membership in the U.S. National Academy of Sciences; Penrose Medal and Career Contribution Award in Tectonics from the Geological Society of America; fellowship in the American Academy of Arts and Sciences; an Honorary D.Sc. from the University of Louvain, Belgium; biography included in Who’s Who in America and Who’s Who in the World; and others.
My field studies over Earth have been significantly supported by my universities, the National Science Foundation, a Fulbright Award to Austria, a Guggenheim Scholarship to Switzerland, and geological surveys, organizations and universities in Australia, Brazil, New Zealand, South Africa, China, and India, and several petroleum companies.